


Even amidst economic uncertainty, the 2025 holiday season’s retail ecommerce sales in the United States will break records. Black Friday sales alone are expected to exceed $12 billion in the United States, and $80 billion globally.
So, how does a brand win BFCM?
The first step is to plan ahead. But, sometimes even when you plan, you can run into things you didn’t anticipate. Everyone talks about planning, but nobody talks about what happens when things don’t go to plan. If we’ve learned anything these last few years in ecommerce, we know that a plan will only get you so far.
BFCM is a key moment that brands need to capitalize on, and BFCM 2025 will be more unpredictable than ever. Businesses need to be agile, make decisions quickly, and adjust marketing efforts in real-time to succeed this year.
READ MORE | Black Friday Marketing Strategy Guide
In this article, we’ll explore some ways that AI can significantly impact your business, from task automation to dynamic ad creatives and more. Utilizing a platform like Triple Whale that provides a streamlined, clear, and coherent view of key revenue drivers will set brands up for success.
Are you ready to win BFCM with AI? Let’s get into it.
Running ads means generating plenty of data, from clicks to purchases to customers who bounce off the page. A brand is often running ads on multiple platforms, and it’s difficult to get a glimpse of how all of its ads are performing simultaneously.
Triple Whale empowers you, the brand owner, with a comprehensive view of data from all platforms at once, and AI is used to analyze data and provide actionable insights in a few ways:
Targeted advertising
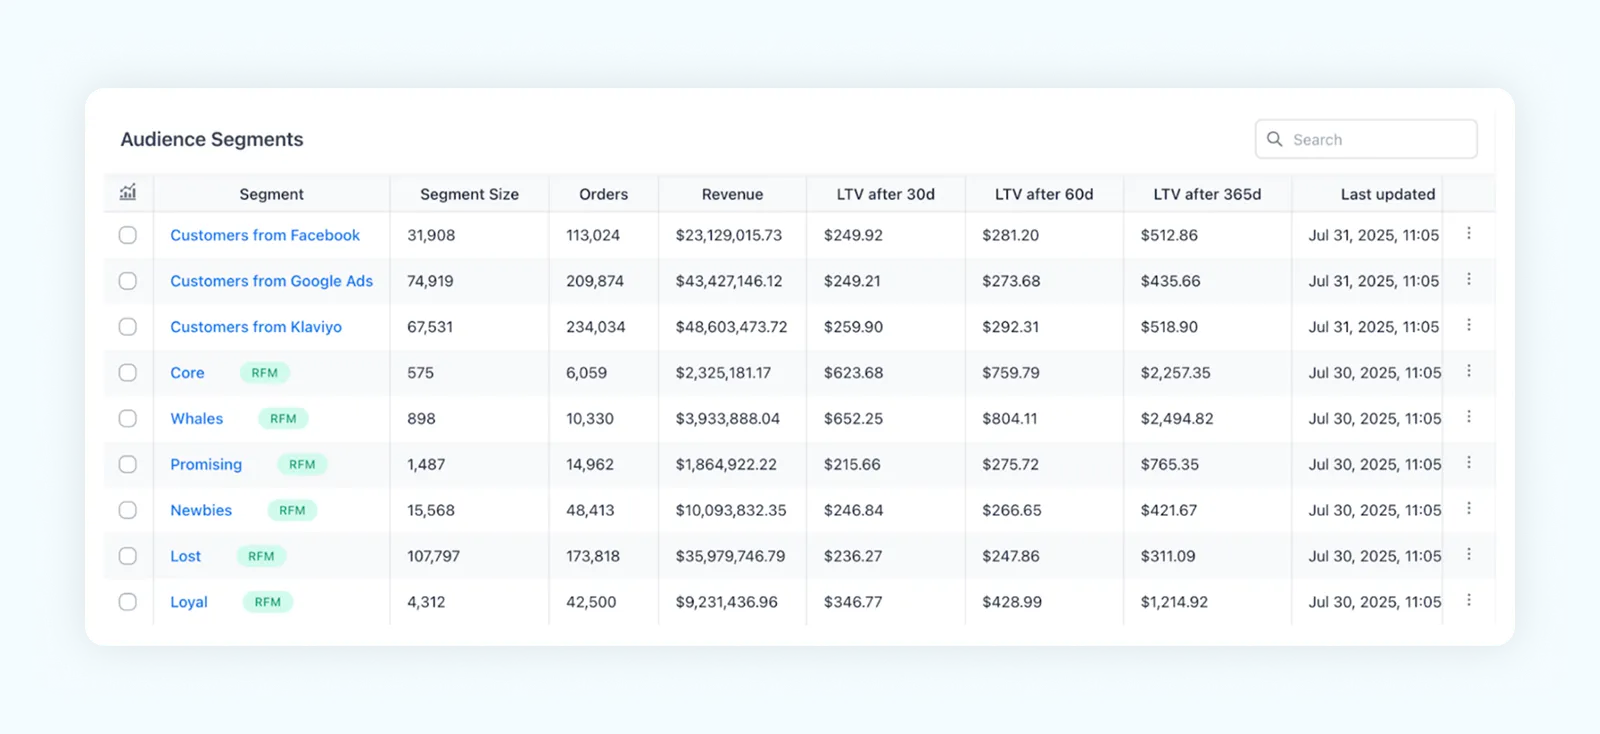
With the Smart Customer Data Platform, you can segment audiences based on their previous purchase history and behavior. Then, you can create specific segments to target with personalized marketing campaigns driven by AI insights.
Dynamic creative optimization
Introducing Moby: an AI agent similar to ChatGPT that’s trained on your business’s data.
From industry trends to company-specific queries, there’s no wrong question for Moby. The bonus is that Moby understands your business and your data — it’s like having an AI assistant who’s a well-informed team member.
With the ability to analyze data within a few seconds, you can ask Moby questions to understand how your business performed during BFCM last year, to allow you to make better-informed decisions about this year’s BFCM.
Ask Moby: “What were my top performing ads over BFCM 2024?” to get an idea of which ads are performing best. Moby can also generate new copy for ads based on the best-performing ones, to provide you with new, dynamic creative options that utilize the best content.
You can then conduct A/B tests within the platform to determine which ad versions are most effective, enabling you to iterate and improve using Triple Whale’s performance analytics.
There’s nothing quite worse than running a sale for a product that’s out of stock – what a waste of money, not to mention your customer’s time and satisfaction level! Triple Whale’s tools allow you to stay on top of stock during the busy BFCM season.
Demand forecasting
Analyzing historical data is a great way to predict future demand, and this knowledge helps ensure you have the right amount of stock for BFCM ahead of time, minimizing the risk of stockouts or overstocking the wrong products.
Real-time sales tracking
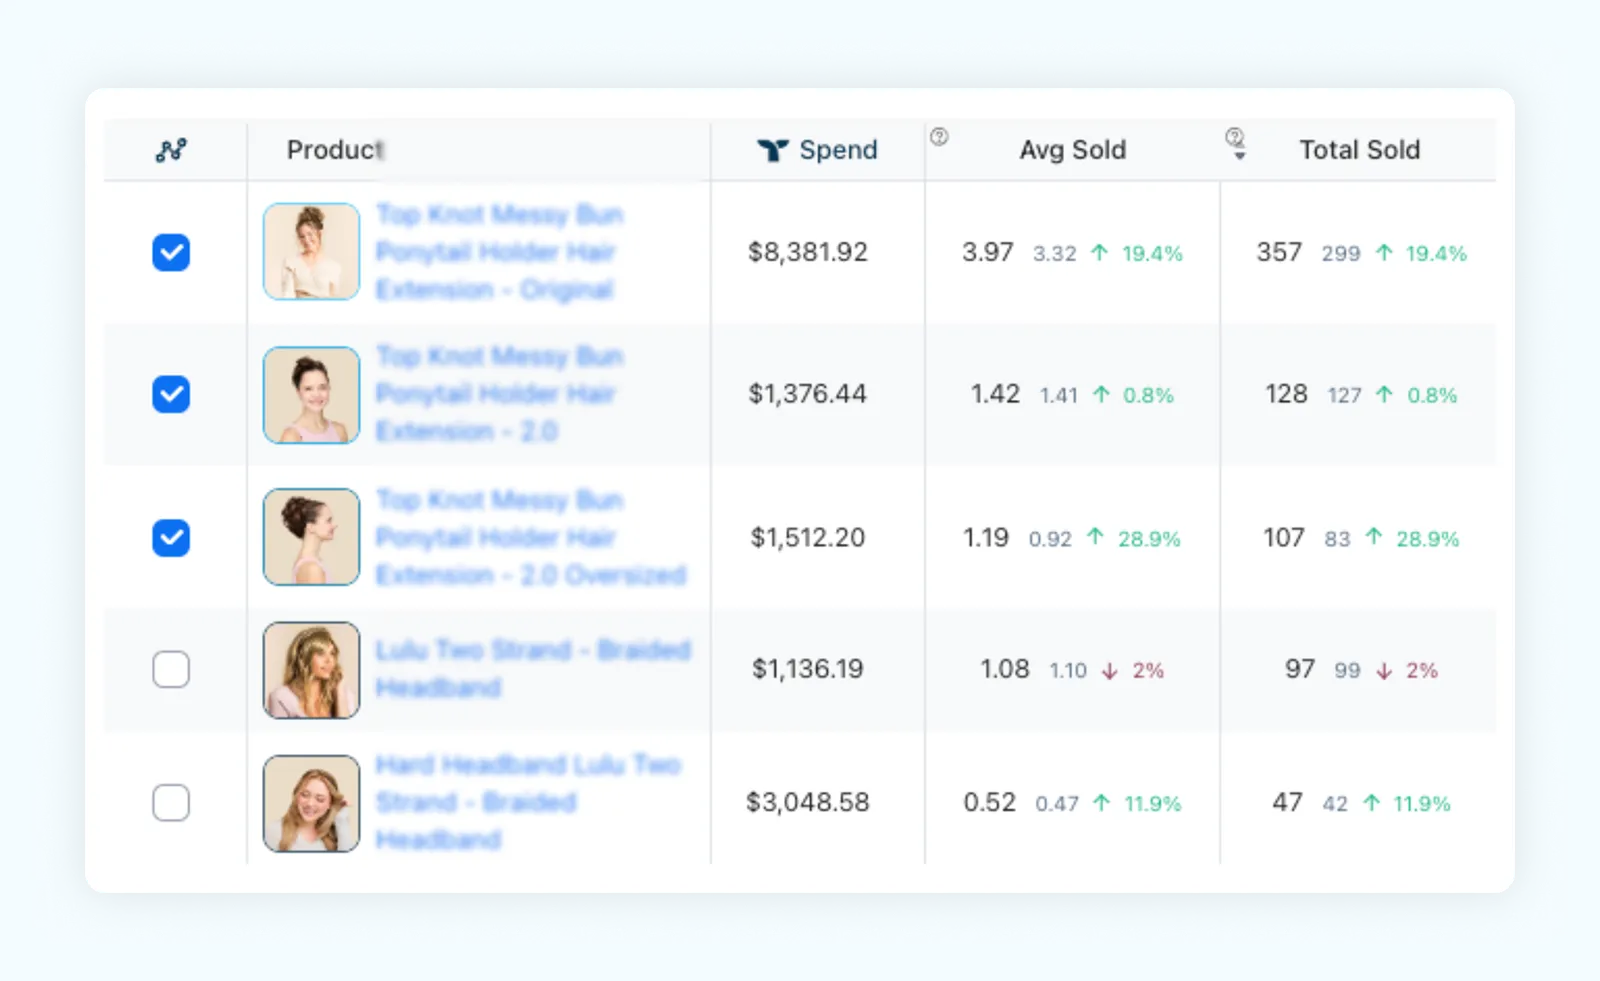
You can monitor your sales in real-time on Triple Whale, allowing you to quickly identify which products are flying off the shelves. This enables you to make swift decisions about reordering or reallocating stock. If you’re running an ad for a product that’s running low on stock, you can quickly identify this and adjust the ads to promote products with more available inventory, keeping customers happy and purchasing!
Product-specific performance insights
A clear view of which products are your best sellers and which are lagging behind can make or break your BFCM. Triple Whale helps you prioritize inventory for the high-demand products that will be your winners for the BFCM event.
Cross-channel inventory management
When selling across multiple channels, stock levels and ad performance data can get a little murky unless you track it all in one place. Triple Whale provides an all-encompassing view of every sales channel to ensure consistency and prevent overselling.
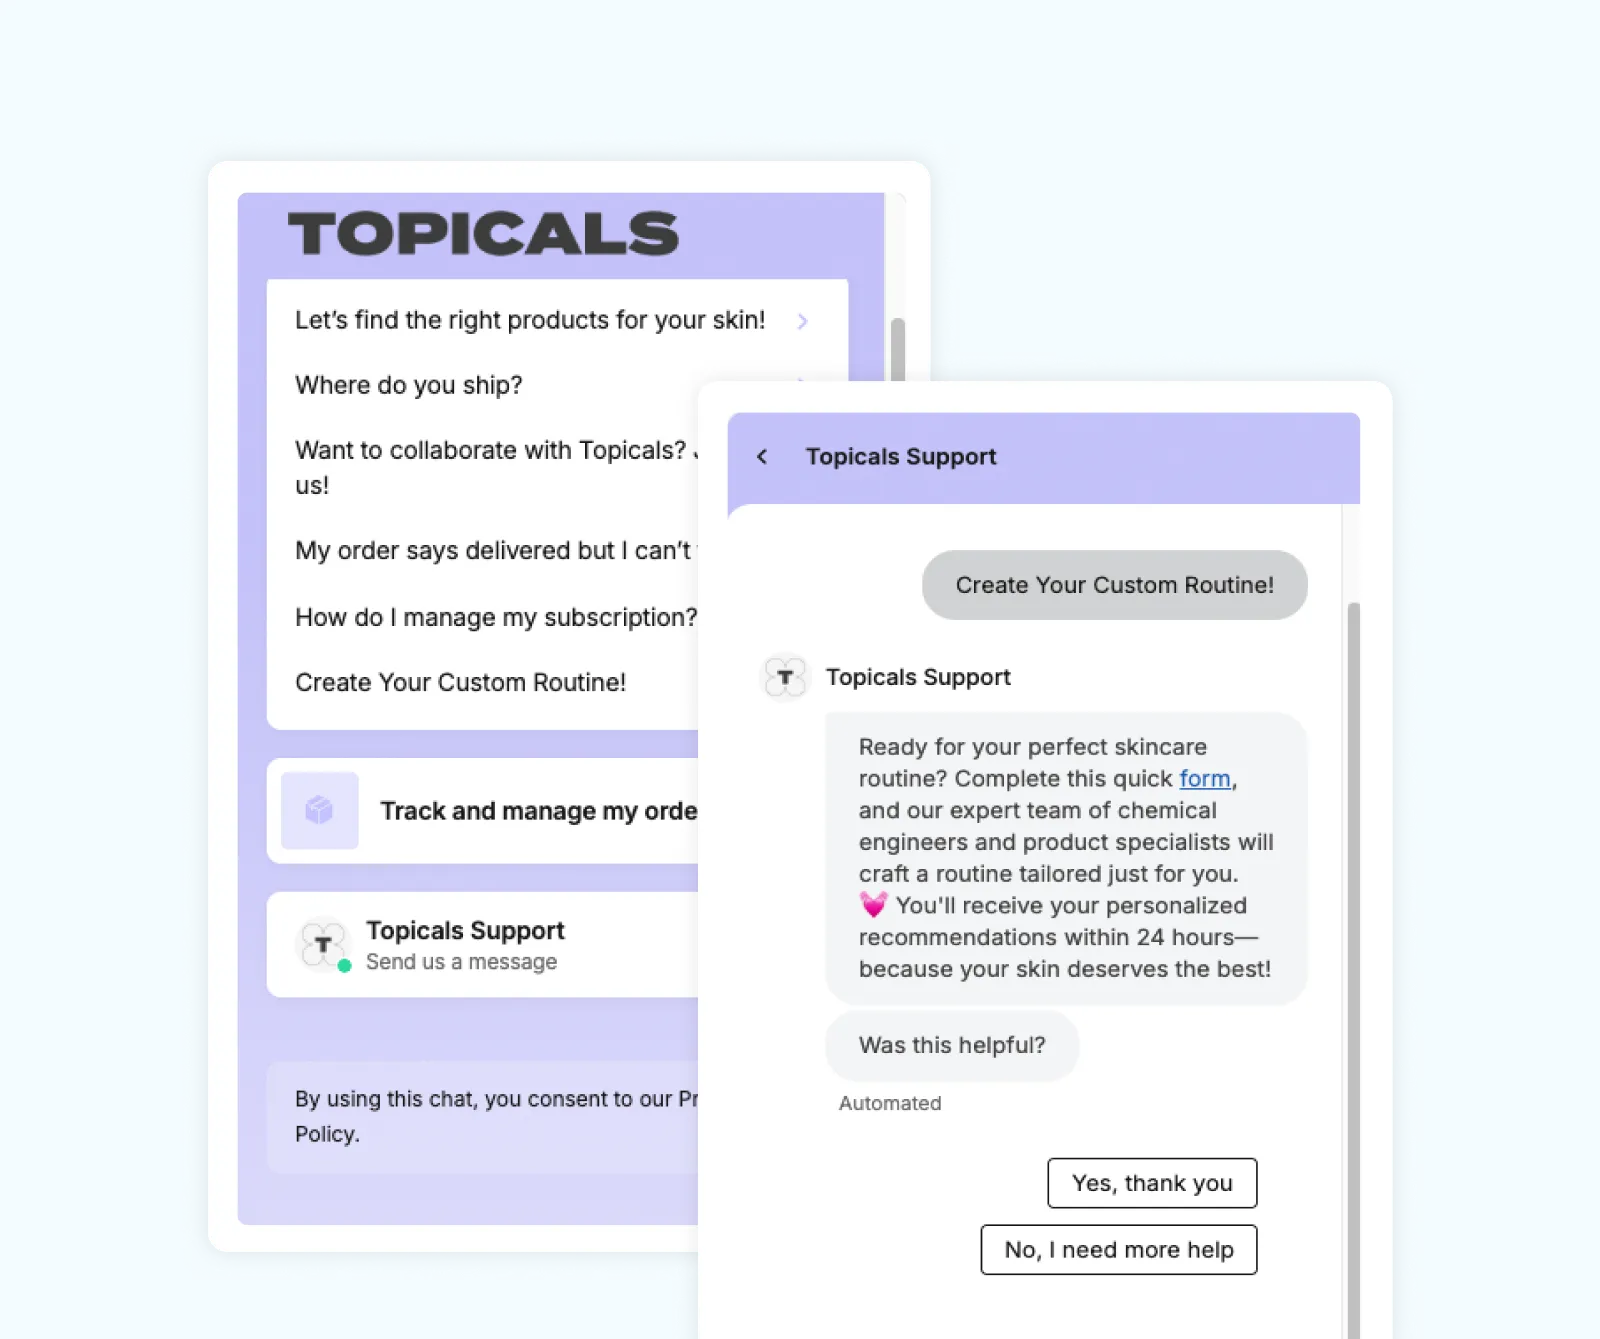
Chatbots and virtual assistants like Gorgias can handle the high volume of customer inquiries you will expect to receive during BFCM. By simplifying the customer experience and providing 24/7 access to support, you’ll be able to lift the burden of common questions that can bog down your live agents. AI chatbots ensure your customers have the answers they need and allow your live agents to focus on more pressing issues.
Gorgias’s customer Topicals used their Quick Response Flows feature in the chat widget and were able to deflect 69% of tickets that would have required a live agent’s attention, along with associated wait times.
One of the biggest benefits of using Triple Whale during BFCM is the ability to monitor sales and performance in real time, adapting marketing strategies on the fly based on AI insights.
Real-time dashboards
Aggregating all of your data from various sources in one place allows you to monitor sales, ad performance, and customer behavior events as they happen. This enables you to quickly identify trends and make the necessary adjustments to improve.
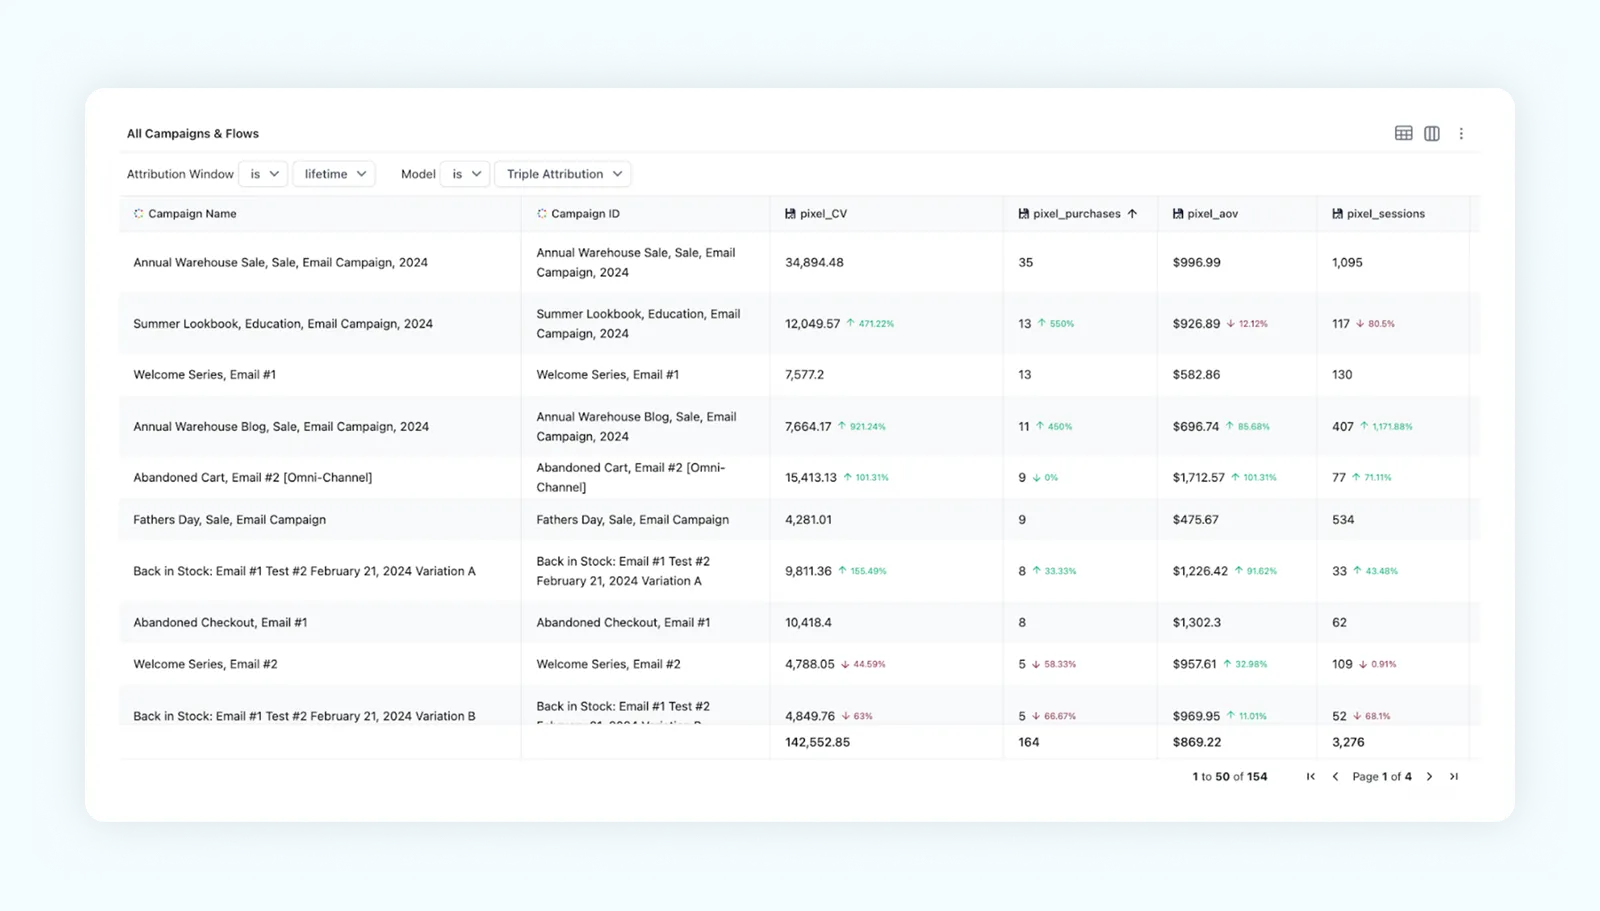
Attribution insights
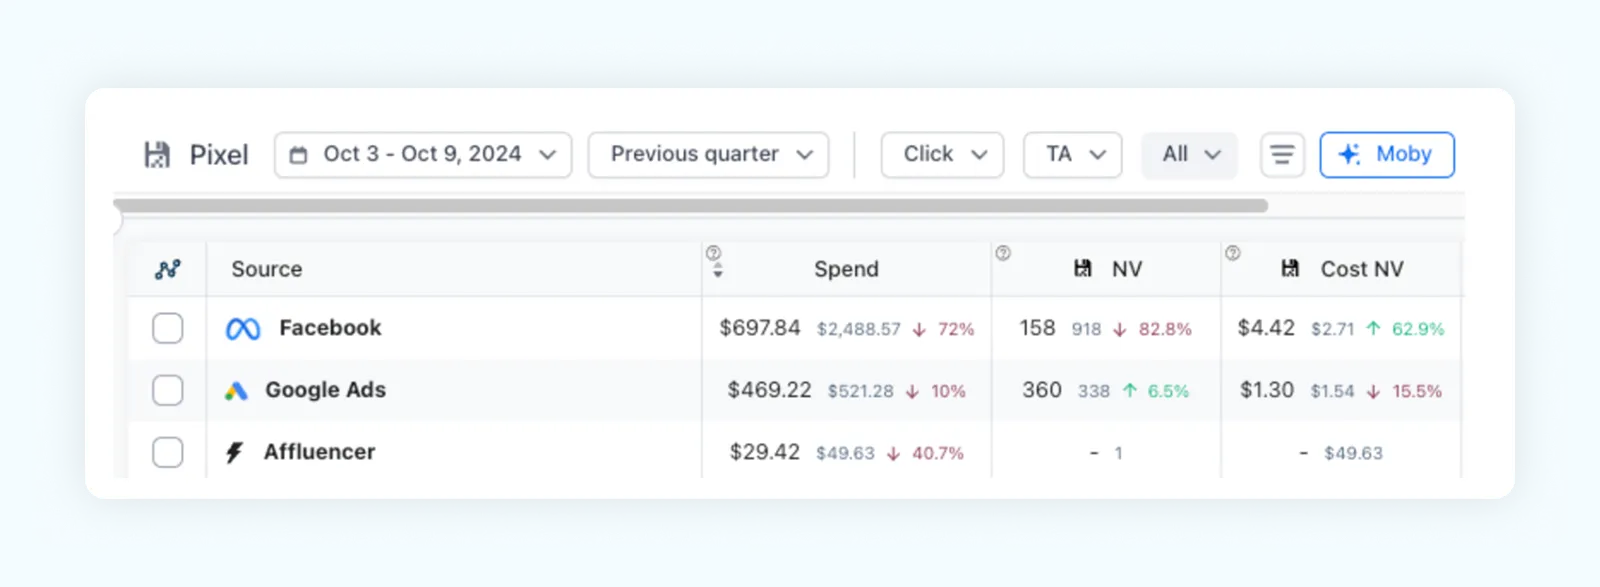
Triple Whale’s comprehensive view of all marketing channels allows you to understand and track which channels are driving the most conversions in real time. With these critical insights, you can allocate your ad budget more effectively during the high-traffic period to capitalize on more sales.
There are many metrics to track and many decisions that need to be made quickly with the correct information at your fingertips.
That’s why we built these two boards specifically for mastering BFCM:
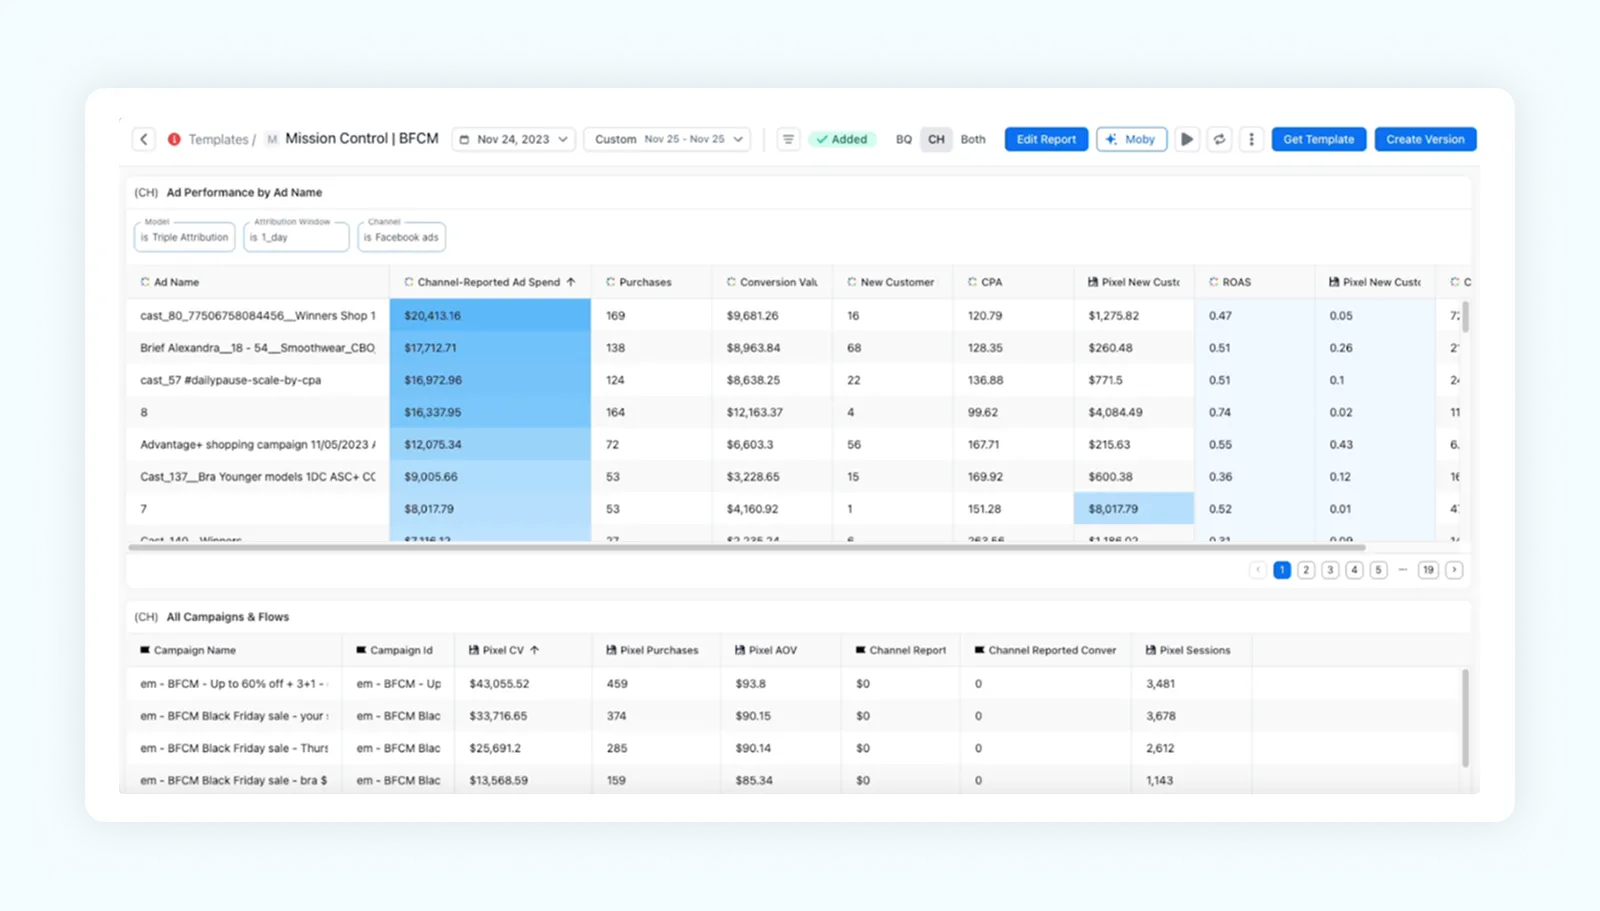
The BFCM Mission Control Board should act exactly as it sounds: your anchor in the craziness of BFCM. It’s full of useful widgets that cover everything you’ll need to keep track of during the event. It should be used to, first and foremost, take a look at your metrics from last year to set goals for how you expect to perform in 2025.
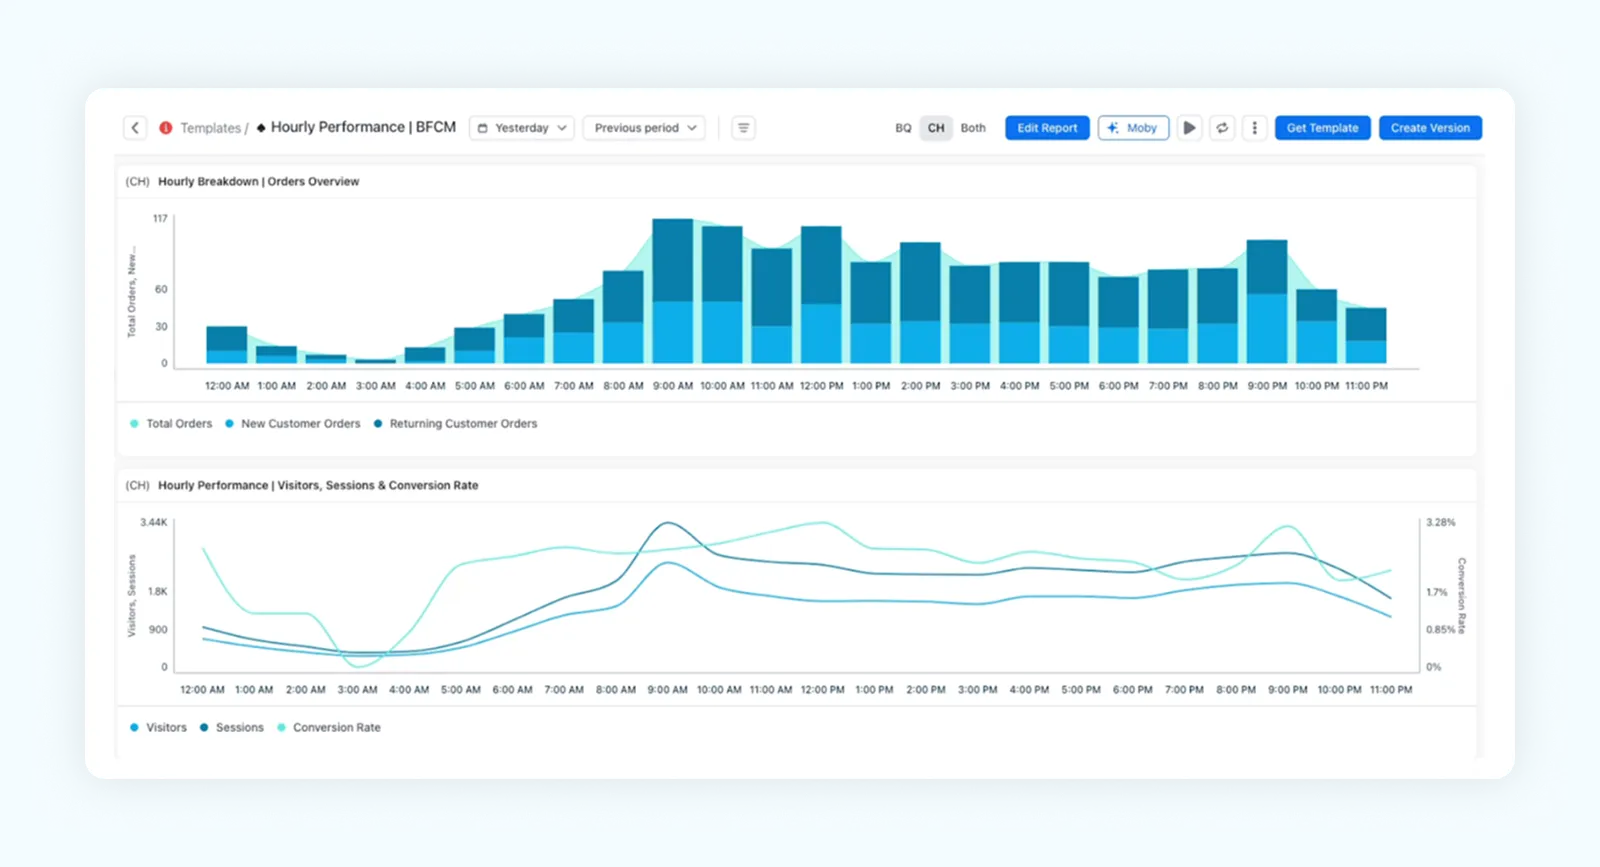
What better way to analyze your performance to stay quick with your decision than with an hourly performance review? Here’s an easy way to see cumulative revenue, cumulative contribution dollars, and total revenue, hour by hour, throughout the day.
As you’re spending money, you’ll have a clear view of your top line metrics. As you are running ads, you can analyze performance and understand which of your ads are performing well to iterate and improve on them.
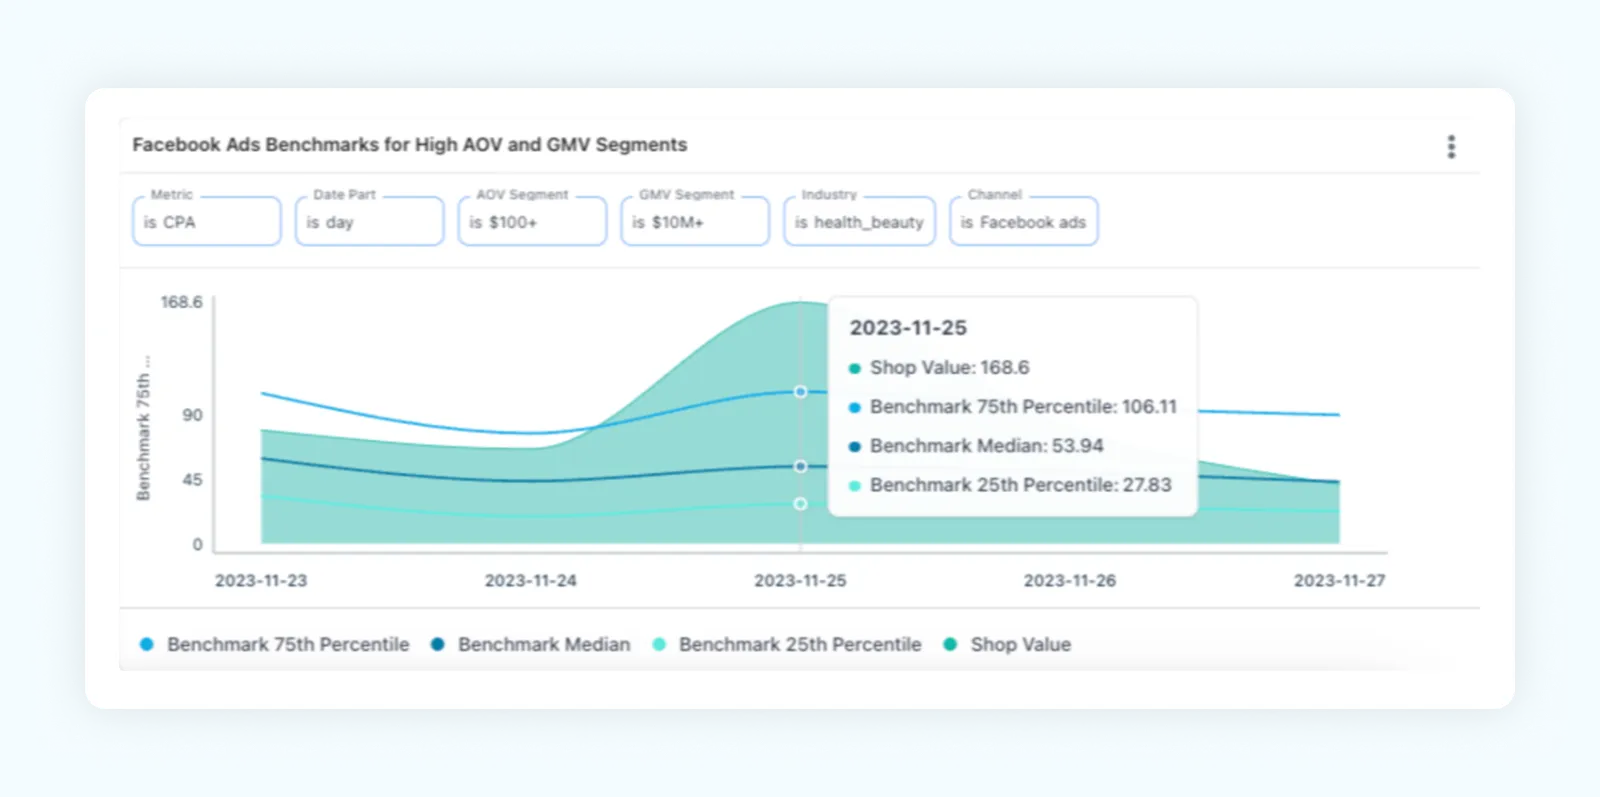
Compare your performance against industry benchmarks to see how yo stack up against your peers! A great way to evaluate your performance at a glance is to determine how metrics like ROAS, AOV, CPA, CPC, and more compare to other brands in your industry. You can filter by AOV segment, Industry, GMV segment, and ad channel to get more granular insights.
You have a lot of data. Moby has many of the answers.
Here are a few sample queries you can use with Moby to obtain some actionable insights:
"What were the top-selling products from last year's BFCM? Show me key product analytics, including total sales, total revenue, AOV, gross profit, and contribution margin per item.""During the 2024 holiday shopping season (November - December 2024), which hours of the day saw the most website visitors? Which hours had the highest conversion rates and sales?""Analyze which BFCM 2024 creatives maintained or improved efficiency when we increased spend. Identify:
- Creatives with the best scaling potential
- Audience segments most responsive to winning creative themes
- Budget levels where performance remained stable
- Creative elements that predict scalability
Recommend which creative themes have the highest scaling potential for BFCM 2025 and optimal budget allocation strategies."Want even more sample prompts to make BFCM a breeze? Check out The Ultimate LLM Prompting Guide for Ecommerce Brands to grab prompts to help analyze ad performance, optimize inventory, and more!
The data collected by Triple Whale is extremely useful, and we now can push enriched first-party data back to your marketing platforms, enhancing targeting ability, increasing ROI, and capturing every touchpoint that may have previously fallen through the cracks. By combining website event data with platform data (like from Facebook or Klaviyo), you’re able to obtain a more complete picture of customer journeys.
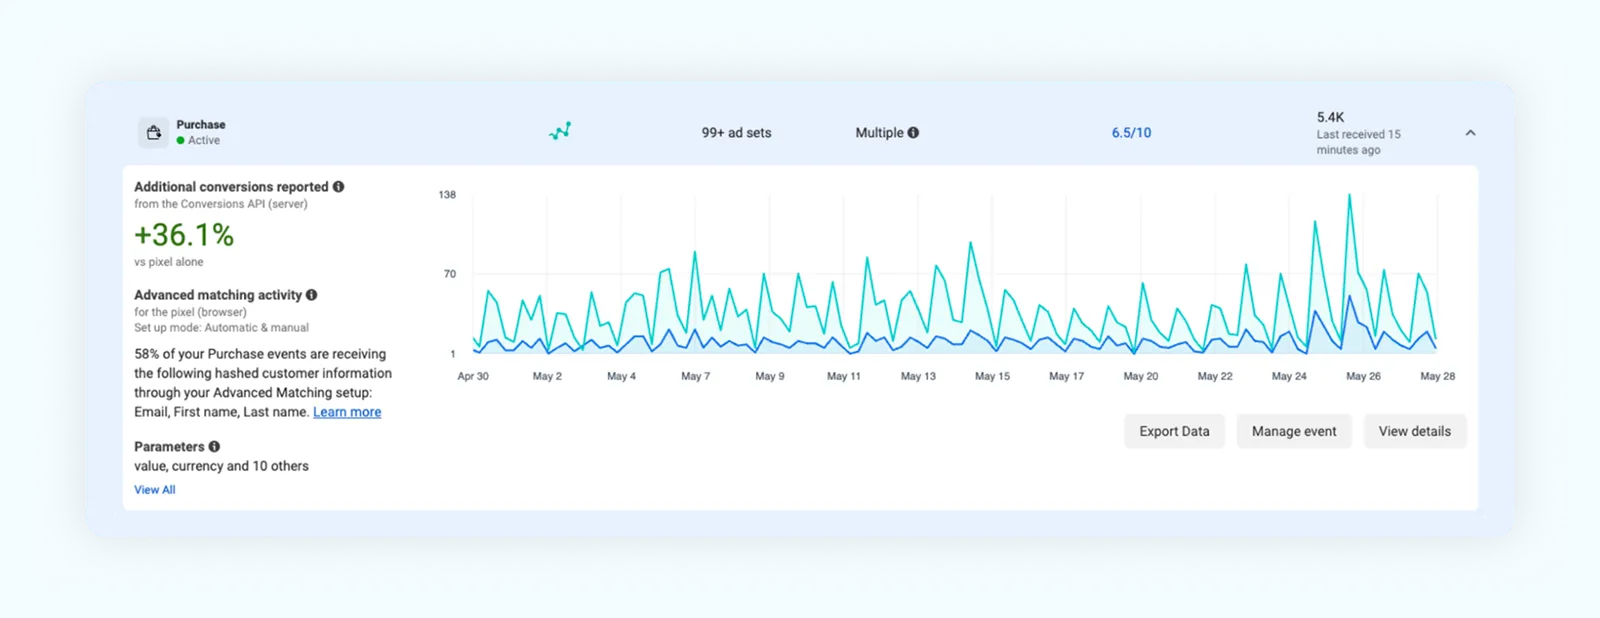
Meta: enriched event data through conversions API (CAPI)
Enriched data sent back to Meta enables brands to drive improved campaign results through better targeting. This is especially important during an event like BFCM when you need detailed customer information to inform campaign targeting that can be adjusted quickly.
Klaviyo: enriched data to trigger more flows and capture lost revenue
The holiday season is a prime time for cart and browse abandonments; the window shopping of today often involves dropping a product you might want to purchase as a gift into a cart and forgetting about it. When Sonar sends the enriched data back to Klaviyo with details about active on-site events, viewed product events, and add-to-cart events, Klaviyo customers can get their message in front of the right people at the right time. With more complete data, you’ll be able to capture revenue that would have otherwise been lost to the abyss.
With these eight tips for mastering AI-based tools, we hope you’ll be ready to take BFCM by the horns both directly ahead and during the event! Stay agile, stay informed, and keep the revenue flowing.
Need more inspiration for taking BFCM 2025 by storm? Check out our BFCM Resource Hub for guides, checklists, and resources!
Even amidst economic uncertainty, the 2025 holiday season’s retail ecommerce sales in the United States will break records. Black Friday sales alone are expected to exceed $12 billion in the United States, and $80 billion globally.
So, how does a brand win BFCM?
The first step is to plan ahead. But, sometimes even when you plan, you can run into things you didn’t anticipate. Everyone talks about planning, but nobody talks about what happens when things don’t go to plan. If we’ve learned anything these last few years in ecommerce, we know that a plan will only get you so far.
BFCM is a key moment that brands need to capitalize on, and BFCM 2025 will be more unpredictable than ever. Businesses need to be agile, make decisions quickly, and adjust marketing efforts in real-time to succeed this year.
READ MORE | Black Friday Marketing Strategy Guide
In this article, we’ll explore some ways that AI can significantly impact your business, from task automation to dynamic ad creatives and more. Utilizing a platform like Triple Whale that provides a streamlined, clear, and coherent view of key revenue drivers will set brands up for success.
Are you ready to win BFCM with AI? Let’s get into it.
Running ads means generating plenty of data, from clicks to purchases to customers who bounce off the page. A brand is often running ads on multiple platforms, and it’s difficult to get a glimpse of how all of its ads are performing simultaneously.
Triple Whale empowers you, the brand owner, with a comprehensive view of data from all platforms at once, and AI is used to analyze data and provide actionable insights in a few ways:
Targeted advertising
With the Smart Customer Data Platform, you can segment audiences based on their previous purchase history and behavior. Then, you can create specific segments to target with personalized marketing campaigns driven by AI insights.
Dynamic creative optimization
Introducing Moby: an AI agent similar to ChatGPT that’s trained on your business’s data.
From industry trends to company-specific queries, there’s no wrong question for Moby. The bonus is that Moby understands your business and your data — it’s like having an AI assistant who’s a well-informed team member.
With the ability to analyze data within a few seconds, you can ask Moby questions to understand how your business performed during BFCM last year, to allow you to make better-informed decisions about this year’s BFCM.
Ask Moby: “What were my top performing ads over BFCM 2024?” to get an idea of which ads are performing best. Moby can also generate new copy for ads based on the best-performing ones, to provide you with new, dynamic creative options that utilize the best content.
You can then conduct A/B tests within the platform to determine which ad versions are most effective, enabling you to iterate and improve using Triple Whale’s performance analytics.
There’s nothing quite worse than running a sale for a product that’s out of stock – what a waste of money, not to mention your customer’s time and satisfaction level! Triple Whale’s tools allow you to stay on top of stock during the busy BFCM season.
Demand forecasting
Analyzing historical data is a great way to predict future demand, and this knowledge helps ensure you have the right amount of stock for BFCM ahead of time, minimizing the risk of stockouts or overstocking the wrong products.
Real-time sales tracking
You can monitor your sales in real-time on Triple Whale, allowing you to quickly identify which products are flying off the shelves. This enables you to make swift decisions about reordering or reallocating stock. If you’re running an ad for a product that’s running low on stock, you can quickly identify this and adjust the ads to promote products with more available inventory, keeping customers happy and purchasing!
Product-specific performance insights
A clear view of which products are your best sellers and which are lagging behind can make or break your BFCM. Triple Whale helps you prioritize inventory for the high-demand products that will be your winners for the BFCM event.
Cross-channel inventory management
When selling across multiple channels, stock levels and ad performance data can get a little murky unless you track it all in one place. Triple Whale provides an all-encompassing view of every sales channel to ensure consistency and prevent overselling.
Chatbots and virtual assistants like Gorgias can handle the high volume of customer inquiries you will expect to receive during BFCM. By simplifying the customer experience and providing 24/7 access to support, you’ll be able to lift the burden of common questions that can bog down your live agents. AI chatbots ensure your customers have the answers they need and allow your live agents to focus on more pressing issues.
Gorgias’s customer Topicals used their Quick Response Flows feature in the chat widget and were able to deflect 69% of tickets that would have required a live agent’s attention, along with associated wait times.
One of the biggest benefits of using Triple Whale during BFCM is the ability to monitor sales and performance in real time, adapting marketing strategies on the fly based on AI insights.
Real-time dashboards
Aggregating all of your data from various sources in one place allows you to monitor sales, ad performance, and customer behavior events as they happen. This enables you to quickly identify trends and make the necessary adjustments to improve.
Attribution insights
Triple Whale’s comprehensive view of all marketing channels allows you to understand and track which channels are driving the most conversions in real time. With these critical insights, you can allocate your ad budget more effectively during the high-traffic period to capitalize on more sales.
There are many metrics to track and many decisions that need to be made quickly with the correct information at your fingertips.
That’s why we built these two boards specifically for mastering BFCM:
The BFCM Mission Control Board should act exactly as it sounds: your anchor in the craziness of BFCM. It’s full of useful widgets that cover everything you’ll need to keep track of during the event. It should be used to, first and foremost, take a look at your metrics from last year to set goals for how you expect to perform in 2025.
What better way to analyze your performance to stay quick with your decision than with an hourly performance review? Here’s an easy way to see cumulative revenue, cumulative contribution dollars, and total revenue, hour by hour, throughout the day.
As you’re spending money, you’ll have a clear view of your top line metrics. As you are running ads, you can analyze performance and understand which of your ads are performing well to iterate and improve on them.
Compare your performance against industry benchmarks to see how yo stack up against your peers! A great way to evaluate your performance at a glance is to determine how metrics like ROAS, AOV, CPA, CPC, and more compare to other brands in your industry. You can filter by AOV segment, Industry, GMV segment, and ad channel to get more granular insights.
You have a lot of data. Moby has many of the answers.
Here are a few sample queries you can use with Moby to obtain some actionable insights:
"What were the top-selling products from last year's BFCM? Show me key product analytics, including total sales, total revenue, AOV, gross profit, and contribution margin per item.""During the 2024 holiday shopping season (November - December 2024), which hours of the day saw the most website visitors? Which hours had the highest conversion rates and sales?""Analyze which BFCM 2024 creatives maintained or improved efficiency when we increased spend. Identify:
- Creatives with the best scaling potential
- Audience segments most responsive to winning creative themes
- Budget levels where performance remained stable
- Creative elements that predict scalability
Recommend which creative themes have the highest scaling potential for BFCM 2025 and optimal budget allocation strategies."Want even more sample prompts to make BFCM a breeze? Check out The Ultimate LLM Prompting Guide for Ecommerce Brands to grab prompts to help analyze ad performance, optimize inventory, and more!
The data collected by Triple Whale is extremely useful, and we now can push enriched first-party data back to your marketing platforms, enhancing targeting ability, increasing ROI, and capturing every touchpoint that may have previously fallen through the cracks. By combining website event data with platform data (like from Facebook or Klaviyo), you’re able to obtain a more complete picture of customer journeys.
Meta: enriched event data through conversions API (CAPI)
Enriched data sent back to Meta enables brands to drive improved campaign results through better targeting. This is especially important during an event like BFCM when you need detailed customer information to inform campaign targeting that can be adjusted quickly.
Klaviyo: enriched data to trigger more flows and capture lost revenue
The holiday season is a prime time for cart and browse abandonments; the window shopping of today often involves dropping a product you might want to purchase as a gift into a cart and forgetting about it. When Sonar sends the enriched data back to Klaviyo with details about active on-site events, viewed product events, and add-to-cart events, Klaviyo customers can get their message in front of the right people at the right time. With more complete data, you’ll be able to capture revenue that would have otherwise been lost to the abyss.
With these eight tips for mastering AI-based tools, we hope you’ll be ready to take BFCM by the horns both directly ahead and during the event! Stay agile, stay informed, and keep the revenue flowing.
Need more inspiration for taking BFCM 2025 by storm? Check out our BFCM Resource Hub for guides, checklists, and resources!


Body Copy: The following benchmarks compare advertising metrics from April 1-17 to the previous period. Considering President Trump first unveiled his tariffs on April 2, the timing corresponds with potential changes in advertising behavior among ecommerce brands (though it isn’t necessarily correlated).


.webp)

.webp)


.png)


.jpg)
.png)
.png)
.png)