In Triple Whale’s BFCM 2025 Breakdown, we analyzed performance across more than 33,000 businesses to understand how ecommerce brands invested across the busiest shopping weekend of the year.
On one hand, Google was the second-largest paid media channel, accounting for 22.65% of tracked ad spend and delivering a 3.62x ROAS.
On the other hand, Google Ads became more expensive year over year. This put pressure on brands to understand which campaigns were driving profitable growth and where they needed to act quickly.
This guide breaks down the Google Ads benchmarks behind these results. It also shows you how Triple Whale can help you apply these insights to your 2026 Black Friday Google Ads strategy.
What changed in Google Ads performance for BFCM 2025
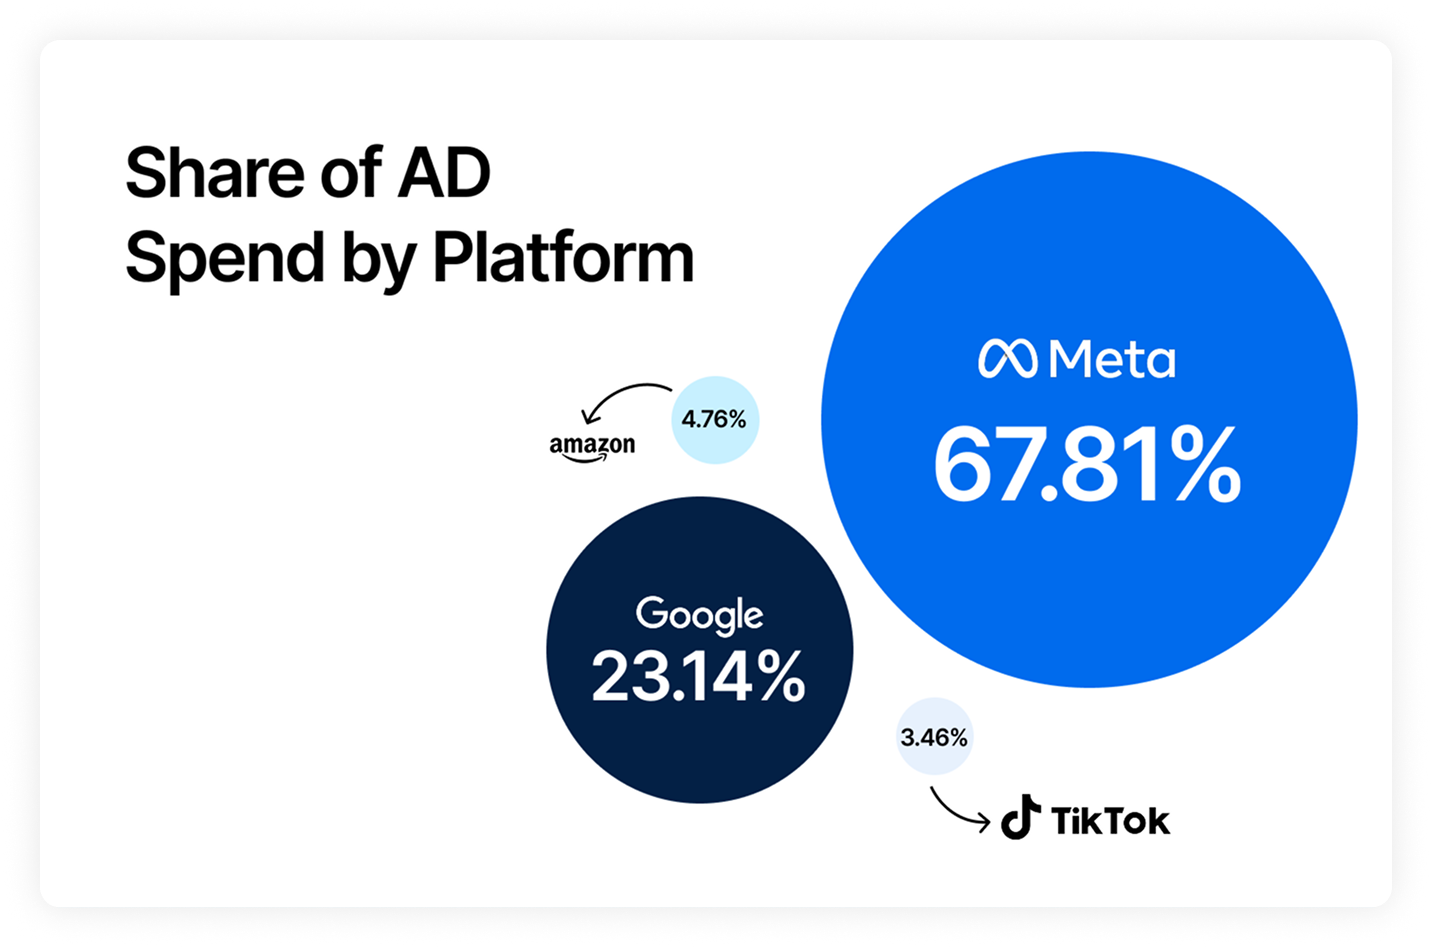
Across all shops in our report, 22.65% of total BFCM ad spend went to Google Ads, second only to Meta ads at 67.6%. Although Google’s share declined 2.12% year over year as brands diversified their media mix, the channel continued to deliver strong returns and higher order values.
The tradeoff was cost: advertisers paid more to reach and acquire customers, creating a mixed performance picture heading into BFCM 2026.
CPM continued to rise
It got more expensive to get eyes on your content during BFCM 2025. Google Ads’ cost per thousand impressions (CPM) reached $20.58 across all shops, up 10.57% year over year, which meant brands had to work harder to make every impression count.
What this means: That increase may make cheaper channels look more appealing, but CPM only tells part of the story. Before shifting budget, look at whether Google is still bringing in qualified traffic and profitable conversions, then adjust spend based on the results.
CPA continued to climb
Acquiring customers became significantly more expensive during BFCM 2025. Average CPA on Google Ads reached $26.31, up 34.18% year over year, while ROAS fell 21.09% to 3.62. Together, those shifts show how quickly rising acquisition costs can put pressure on returns during peak season.
One reason may be that shoppers are taking longer to compare products and weigh discounts before making a purchase, especially for non-essential items. Longer decision cycles can mean more browsing and more touchpoints before conversion, making it important to evaluate performance with an attribution window that reflects how your customers actually shop.
The good news: Google Ads were effective
Even as acquisition costs rose, Google continued to deliver some of the strongest commercial outcomes in the report. AOV increased 4.04% to $88.78, the second highest among the platforms measured. Google Ads are still working; the bar for profitable performance is simply higher.
ROAS remained strong
Google also led every platform in return on ad spend, delivering a 3.62x ROAS compared with Amazon at 3.07x, Pinterest at 2.36x, Meta and TikTok at 2.26x, and AppLovin at 1.35x. That result came despite a 21.09% year-over-year decline, showing that Google remained a strong revenue driver even as efficiency tightened.
AOV moved higher
Google produced an $88.78 AOV, up 4.04% year over year and second only to Pinterest among the platforms in the report. Larger baskets helped, but they did not fully offset rising acquisition costs: Google’s aggregate ROAS still declined.
What this means: That makes product and offer mix more important in 2026. Give budget to products that can support the acquisition cost, not simply those with the most traffic or the highest platform-reported conversion volume.
Google campaign performance by channel
Performance varied widely across Google’s campaign types during BFCM 2025. Performance Max, Search, and Shopping carried most of the budget, while Demand Gen, Display, Video, Smart, and Multi-channel operated at much smaller scales.
| Campaign Type |
Conversion Value |
Spend |
ROAS |
CPA |
CPM |
| Performance Max |
$235M |
$57M |
3.15 |
$29.44 |
$16.64 |
| Search |
$185M |
$30M |
4.68 |
$20.00 |
$193.29 |
| Shopping |
$79M |
$23M |
3.23 |
$26.34 |
$14.05 |
| Demand Gen |
$10M |
$8M |
1.3 |
$54.74 |
$11.25 |
| Display |
$574K |
$284K |
1.98 |
$37.84 |
$5.44 |
| Video |
$184K |
$464K |
0.59 |
$66.29 |
$6.23 |
| Smart |
$36K |
$5K |
3.93 |
$1.33 |
$23.42 |
| Multi-Channel |
$4K |
$10K |
0.57 |
$1.63 |
$9.44 |
What this shows is that:
Spend was highly concentrated
Performance Max, Search, and Shopping accounted for $110 million of the approximately $118.8 million in Google spend shown in the table, or about 93%. Performance Max drove the most conversion value at $235 million, while Search generated the strongest return among the scaled campaign types at 4.68x ROAS and the lowest CPA at $20.00.
Demand Gen and Video faced the clearest efficiency pressure
Demand Gen produced a 1.30x ROAS and $54.74 CPA on $8 million in spend. Video returned 0.59x with a $66.29 CPA, although its $464,000 spend was small relative to the three largest campaign types.
Lower CPM did not always translate into stronger returns
Display and Video had the lowest CPMs at $5.44 and $6.23, but delivered 1.98x and 0.59x ROAS, respectively. Search had the highest CPM at $193.29 and still produced the strongest ROAS at 4.68x, showing why impression cost should not be evaluated in isolation.
How different industries invested in Google Ads during BFCM 2025
The table compares how Meta, Google, and TikTok ad spend was distributed across industries during BFCM 2025.
| Industry |
Meta |
Google |
TikTok |
| Apparel & Accessories |
28.82% |
28.63% |
31.84% |
| Beauty |
27.58% |
20.19% |
39.99% |
| Home & Garden |
10.15% |
12.93% |
6.71% |
| Sports & Outdoors |
5.38% |
5.19% |
1.70% |
| Toys, Art, & Collectibles |
4.54% |
4.44% |
2.01% |
| Health & Wellness |
2.14% |
2.33% |
0.61% |
| Pets & Animals |
2.96% |
3.22% |
1.51% |
| Electronics |
3.18% |
7.13% |
2.36% |
| Baby |
1.09% |
1.47% |
1.10% |
| Lifestyle & Boutique |
1.04% |
1.14% |
0.59% |
| Automotive |
1.01% |
1.14% |
0.59% |
| Books & Music |
1.09% |
0.54% |
0.26% |
| Media & Publishing |
0.43% |
0.54% |
0.26% |
| Travel & Luggage |
3.79% |
4.15% |
4.05% |
A few categories accounted for a particularly large share of Google spend:
- Apparel & Accessories: 28.63%
- Health & Beauty: 20.19%
- Home & Garden: 12.93%
- Consumer Electronics: 7.13%
- Sports & Outdoors: 5.19%
These categories may account for a larger share of Google’s BFCM spend because the platform reaches shoppers at two important moments: when they have a specific purchase in mind and when they are comparing their options.
1. High purchase intent
Google reaches shoppers when they are actively looking for a product, brand, or solution. That can make the channel especially useful for categories where searches often signal a specific need:
- Apparel & Accessories: Shoppers search for specific brands, products, styles, sizes, or sale terms
- Health & Beauty: Searches often focus on a concern, ingredient, product benefit, or trusted brand
- Home & Garden: Shoppers look for products that solve a defined problem, such as weatherproof furniture or holiday décor
- Consumer Electronics: Model names, features, and replacement needs can produce highly specific searches
2. Research and comparison
Google also gives shoppers a direct path to compare products before buying. That behavior is especially relevant during BFCM, when customers are weighing discounts, features, reviews, and availability across multiple retailers:
- Apparel & Accessories: Brand, style, price, and fit can shape the final choice
- Health & Beauty: Shoppers may compare ingredients, reviews, routines, or product claims
- Home & Garden and Consumer Electronics: Feature- and specification-based searches reflect more considered purchase decisions
Meta and TikTok often play a larger role in introducing shoppers to products through visual, discovery-led advertising. Google can become more important once a customer knows what they want — or at least what problem they need to solve — and begins actively searching.
Google Ads strategies for BFCM 2026
Higher costs make measurement quality and operating speed more important than one-size-fits-all channel rules. For BFCM 2026, focus on connecting Google Ads performance to business outcomes, moving from analysis to supported action faster, and giving Google stronger conversion signals.
That means putting connected performance data, clear approval rules, repeatable checks, and stronger first-party signals at the center of the plan.
Use Moby AI to move from analysis to approved action
Moby AI is Triple Whale’s AI operator for ecommerce. It works from connected, real-time context of your business to analyze performance, investigate changes, recommend next steps, and carry out approved work across your stack.
For Google Ads teams, that means moving from a performance question to a supported account change without losing visibility or control. Current Google Ads capabilities include:
- Launch and structure campaigns: Create campaigns, ad groups, responsive search ads, and Performance Max asset groups
- Control spend and bidding: Change campaign budgets, update bidding strategies, and adjust CPA or ROAS targets
- Manage delivery: Pause or activate campaigns, ad groups, and ads
- Refine targeting: Add or remove keywords, update targeting criteria, and create or update audiences
- Manage Performance Max: Add or remove audience signals and search themes and update listing-group filters
- Maintain campaign inputs: Manage assets, custom and data segments, customer lists, conversion actions, and conversion goals
Turn repeatable BFCM checks into Moby Automations
BFCM performance can change by the hour, leaving little time for repeated pacing reports and manual account checks. Moby Automations turns that recurring work into scheduled workflows powered by your connected Triple Whale data. Teams define what Moby should monitor, when it should run, and how it should respond when performance crosses an approved rule or threshold.
During peak week, that can help you:
- Keep spend on pace: Compare actual spend with the approved daily plan and flag sudden spikes, slowdowns, or campaigns drifting off target
- Protect acquisition targets: Identify campaigns that exceed an approved CPA threshold and prepare a supported budget, bid, or status change for review
- Prioritize new-customer growth: Surface high-spend campaigns with weak Triple Whale-attributed new-customer revenue before they absorb more peak-period budget
- Catch wasted search spend: Flag queries that continue gaining spend without conversions so teams can review keywords, match types, or exclusions
- Stay ahead of budget caps: Warn when high-performing campaigns are likely to exhaust their budgets during peak hours, while there is still time to respond
- Keep leaders up to speed: Deliver focused morning and evening recaps covering sales, spend, ROAS, emerging risks, and recommended next steps
Strengthen Google Ads signals with Sonar Optimize
Google’s automated bidding is only as useful as the conversion signals it receives. When those signals are incomplete, reporting and optimization have less context to work with. Sonar Optimize connects Triple Whale directly with Google Ads and sends enriched first-party events as conversion actions, giving Google a fuller view of the customer journey.
With Sonar Optimize, you can:
- Build a fuller conversion signal: Send events from page view and add to cart through checkout and purchase
- Optimize toward customer quality: Distinguish new-customer purchases from returning-customer purchases instead of treating every order the same
- Connect measurement with optimization: Send Triple Whale-attributed conversion events back to Google Ads using the attribution model that matches the team’s measurement strategy
- Monitor data delivery: Review event transmission in Triple Whale and confirm that Google Ads is receiving the conversion actions
Turn insights into action this BFCM
With high-intent Search, Shopping, and Performance Max campaigns, Google remains one of the most important demand-capture channels during BFCM. But as CPM and CPA rise, success depends on more than increasing spend. Teams need clear measurement, stronger conversion signals, and the ability to act quickly when performance changes.
Use the benchmarks in this article to compare your BFCM 2025 performance and prepare for 2026. Triple Whale brings campaign, customer, and revenue data together; Sonar Optimize strengthens the signals sent to Google; and Moby helps teams turn findings into governed action. Combined with cross-channel coordination, these tools give brands a faster way to protect efficiency and capture peak demand.
Ready to crush BFCM 2026? Book a demo to see how Triple Whale can help your team put these insights into action.
Black Friday Google Ads FAQs
How much of BFCM ad spend went to Google Ads in 2025?
Google Ads accounted for 22.65% of total BFCM ad spend in 2025, second only to Meta. Its share declined 2.12% year over year.
Did Google Ads costs increase during BFCM 2025?
Yes. During BFCM 2025, Google Ads costs increased year over year:
- CPM rose 10.57% to $20.58
- CPA rose 34.18% to $26.31
At the same time, Google’s ROAS declined 21.09% to 3.62x, showing that advertisers paid more to reach and acquire customers.
Are Google Ads still effective for Black Friday despite rising costs?
Yes. Google Ads delivered a 3.62x ROAS during BFCM 2025 — the highest among the platforms in the report — and an $88.78 average order value. However, CPA rose 34.18%, while ROAS declined 21.09% year over year. Google remained effective, but rising costs made tighter measurement and faster optimization more important.


 Moby AIAsk questions, analyze performance, and work with your business context.
 ActionsTake governed action across the tools that run your business.
 AutomationsSchedule recurring analysis and work that runs on your terms.
 Landing PagesCreative conversion-focused ecommerce pages with Moby.
 Creative StudioGenerate and refine creative grounded in your brand.









.webp)

.webp)
