


It’s easy to confuse common marketing metrics, especially when you’re trying to keep track of several different (yet similar) acronyms. That’s often the case for folks who are comparing ROI vs. ROAS. And while the two do share some similarities, there are important differences to be aware of, too.
At the highest level, ROI, or return on investment, is the whole pie, or all of the profits from all of your investments in your business. ROAS, or return on ad spend, is just a slice of that pie, specifically the profit generated by every dollar you spend on advertising.
Both are important measures for you to track so you can get the full picture of your success or clearly identify where you have room for improvement. Keep reading for everything you need to know about the difference between ROI and ROAS and how these two figures can help you understand campaign performance, scale your marketing efforts, and ultimately improve profitability.
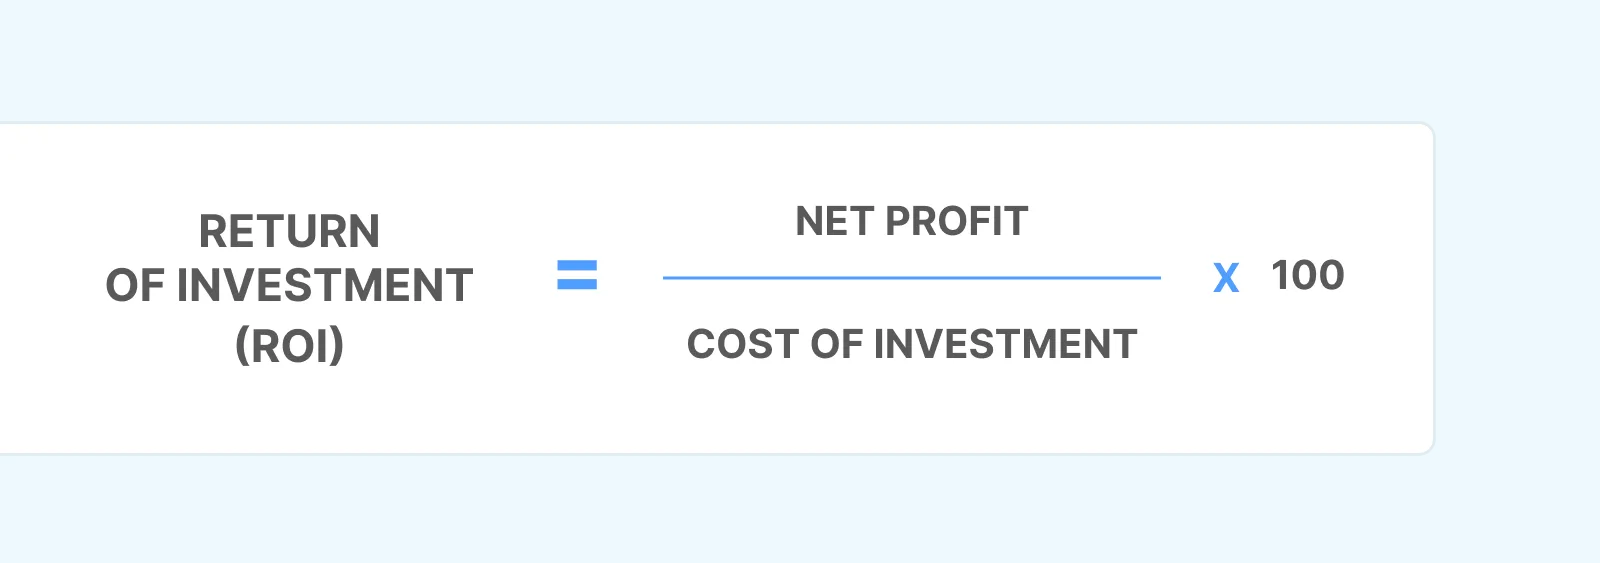
Definition: Return on investment, or ROI, is a marketing metric that measures the profit you made from everything you’ve invested in your business.
Formula: To calculate ROI, divide your net profit by the cost of your investment. Then, multiply that number by 100 so your ROI is expressed as a percentage, according to Harvard Business School.
ROI = (Net Profit / Cost of Investment) x 100
‘Good’ ROI: A “good” ROI varies, depending on your industry, goals, and profit margins, among other factors. But generally speaking, many marketers consider an ROI of 200% or higher to be solid, and 500% or higher to be exceptional.
Best for: ROI is most useful for understanding whether your entire marketing strategy is working. It tells you if your business decision-making has been sound so far, and if you’re continuing down the path of profitability.
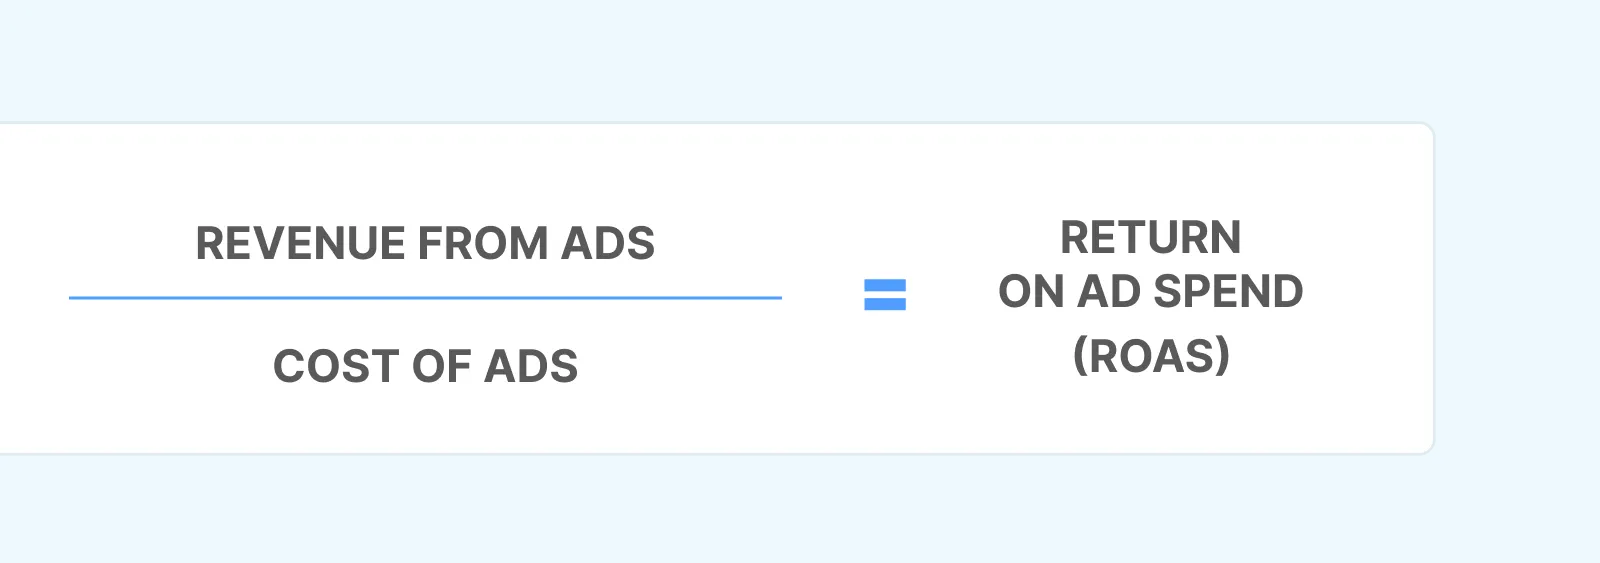
Definition: What does ROAS stand for? ROAS, or return on ad spend, is a marketing metric that evaluates how effective a specific advertising campaign or strategy is. Rather than looking at total profitability, like ROI, ROAS narrows in on one component of your business’s success.
Formula: To calculate ROAS, divide your ad campaign's total revenue by the total cost you spent on it. Here’s how to find ROAS:
ROAS = Revenue from ads / Cost of ads
This process is the same no matter which channel you’re looking at. For example, you would still calculate your Facebook ROAS using this formula, you would just only include the revenue generated from Facebook ads and the cost of running that campaign. Other platforms allow you to set a specific ROAS you want to hit, such as Google’s target ROAS, an Automated Smart Bidding strategy.
‘Good’ ROAS: A “good” ROAS is considered by many marketers to be 2 or higher, although others push for 4 or higher. This value varies so much, depending on factors like business objectives and profit margins, that here at Triple Whale, we actually believe there is no universal good ROAS.
For example, startups may need a higher ROAS to cover costs and achieve financial growth, while established companies can succeed with a lower ROAS. In determining your own “good” ROAS, you may also want to figure out your breakeven ROAS, or when you break even on acquiring a customer.
Best for: ROAS is most useful for understanding how well a particular ad campaign or channel is working. It lets you know if your marketing channels are worth the investment or not.
The metric can also be used to compare one marketing campaign with another to help you identify which one of them is performing better.
There are quite a few differences between ROAS and ROI. It’s important to know these differences, but also to track both these metrics. Your ROAS lets you know if a campaign has been successful in creating clicks, impressions, and revenue. What ROAS fails to reveal is whether your paid ads department is profitable for the company. This is where ROI steps in.
Here are five big differences in ROAS vs. ROI.
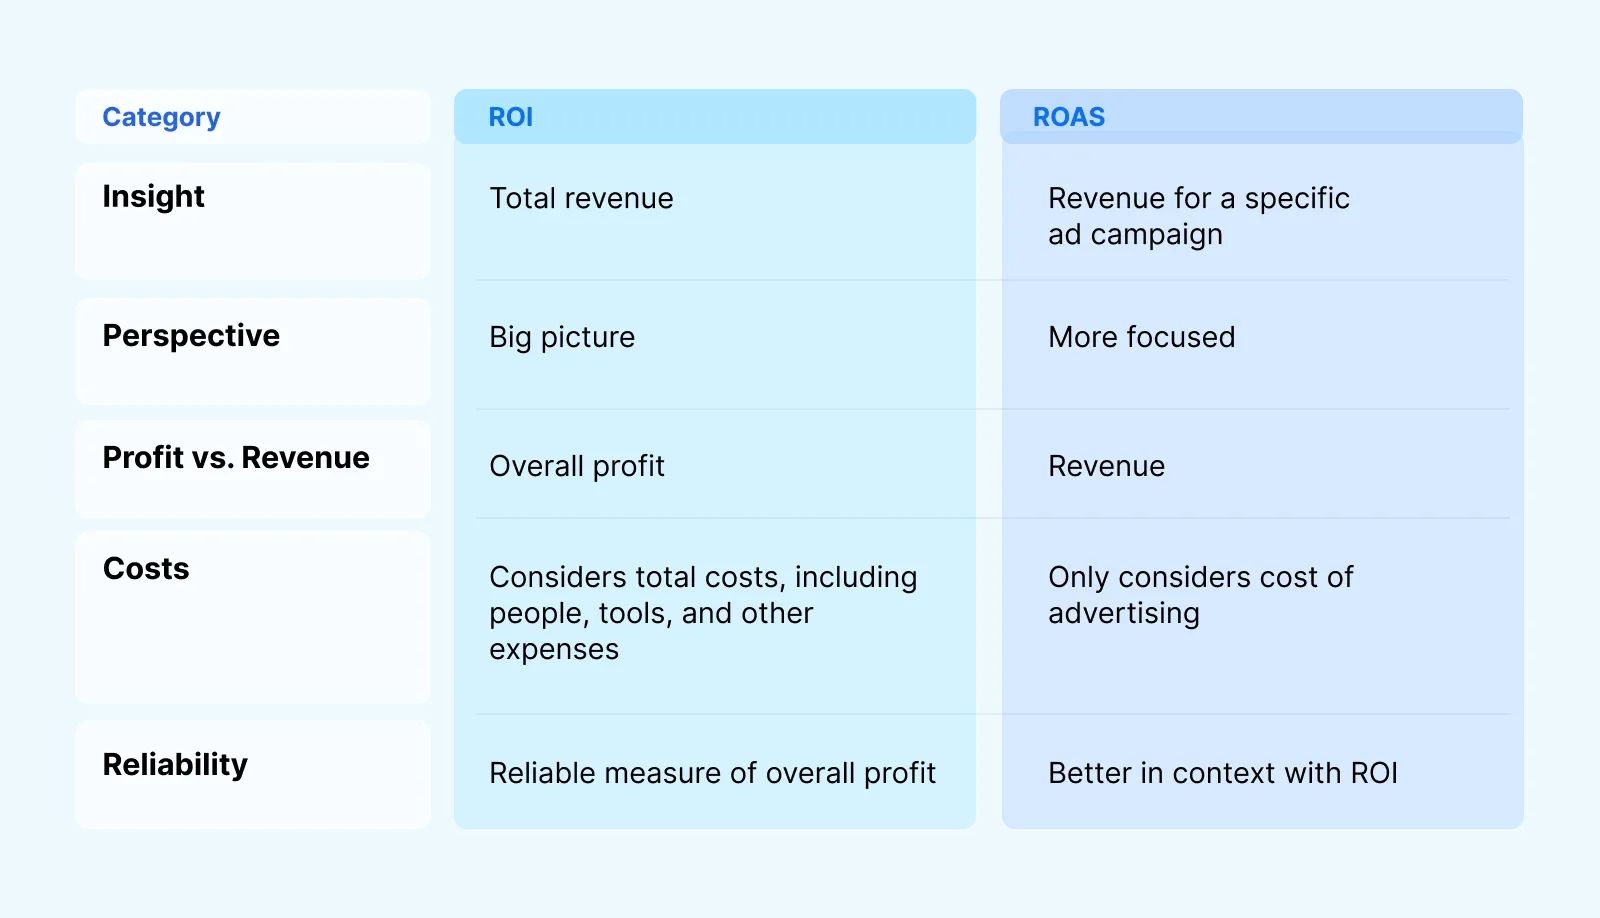
Perhaps the most important difference between ROI and ROAS to be aware of is simply the different perspective these two metrics take.
The insight you’ll take away from knowing and monitoring your ROI is your total revenue.
The insight you learn from calculating your ROAS, on the other hand, is your revenue for a specific ad campaign.
Those insights map naturally to differences in perspective when comparing ROI vs. ROAS. Because ROI tells you your total revenue, it provides a top-level, big-picture perspective on the effectiveness of your business.
ROAS takes a narrower, more focused perspective of marketing effectiveness by measuring the profitability of one particular campaign.
Take another look at the formulas above for ROI and ROAS. Notice that you calculate your ROI using your net profit, meaning it evaluates your profitability after accounting for all of your expenses.
ROAS, on the other hand, only looks at the revenue from a specific campaign in respect to how much you spent on that campaign.
As such, the costs that are factored into identifying your ROI or your ROAS differ, too.
Your ROAS only looks at the marketing spend for the particular campaign you’re evaluating. But ROI considers all the costs associated with running your entire brand, including salaries for employees, subscriptions for tools, shipping, storage, production, customer acquisition cost, and other business expenses.
Both ROI and ROAS are important metrics to monitor for your ongoing success.
But if ROAS is the only metric you calculate, the results will be misleading because ROAS only takes into account your advertising costs. You may have optimized your ROAS, but if you’re not also increasing your ROI, you may still need to improve other areas of your business to make a profit. ROI alone can be a reliable measure of your business’s overall performance, but you shouldn’t use ROAS alone for this type of analysis.
Use ROI if you want a high-level snapshot of your business’s overall profitability.
Use ROAS if you’re looking for the effectiveness of a particular campaign and opportunities to optimize your short-term strategy.
That said, your best bet is to use both, for a well-rounded assessment of your performance.
Let’s take a look at some examples that will help put these calculations into context.
A coffee ecommerce business runs digital advertising campaigns mainly on Google Ads and Instagram to acquire new customers.
Their total investment is $20,000. Their total revenue is $35,000.
That means their ROI calculation is as follows:
ROI = (35,000 - 20,000) / 20,000 x 100 = 75%
They spent $8,000 on ads and made $24,000 in revenue attributed to those ads. That means their ROAS calculation is:
ROAS = 24,000 / 8,000 = 3
These metrics point to financial efficiency for this business: The positive ROI means the coffee company is generating more revenue than its total investment, and the positive ROAS shows its ad campaigns are returning three times what they cost. These marketers will want to keep doing what they’re doing!
Now let’s imagine the same company above only made $15,000 in total revenue, $6,000 of which is attributed to ads. This scenario changes their ROI calculation to:
ROI = (15,000 - 20,000) / 20,000 x 100 = -25%
And it changes their ROAS formula to:
ROAS = 6,000 / 8,000 = 0.75
You’ll see their ROAS isn’t technically a negative number, but they’re not breaking even: For every dollar they spent on ads, they only earned 75 cents, so they’re losing money.
And coupled with an overall negative ROI, they’re going to want to evaluate which ads aren’t working, come up with hypotheses as to why, test alternatives, and recalculate these metrics to measure their improvement. Sometimes profitability requires this kind of constant cycle of iteration!
It’s also possible, however, for a particular ad campaign to underperform, while your business stays profitable.
For example, a productivity company sells an app for $20 per month, and most of their customers find them organically through SEO and referrals. After launching an ad campaign, their total spend comes to $8,000, and $2,000 of that was on ads.
Their total revenue is $10,000, and they determine $600 is from ads.
That means their ROI calculation is as follows:
ROI = (10,000 - 8,000) / 8,000 x 100 = 25%
Their ROAS calculation, on the other hand, paints a different picture:
ROAS = 600 / 2,000 = 0.3
This business’s ROAS is undesirable, as they’re only making 30 cents on every dollar they spent on their ad campaign. But because their organic channels are so efficient, the overall business remains profitable, as reflected by their positive ROI.
This is an opportunity for the brand to analyze their underperforming ads and test changes. But depending on their goals and priorities, they may also decide to double down on the channels that already perform well for them and focus on conversion rate optimization instead, for example.
Then, there may be instances where an ad campaign is profitable but an overall business is not.
Consider an online dropshipping store that sells phone accessories. Paid ads drive all of their sales. Their total costs come to $6,500, and $1,500 of that is ad spend. Their revenue amounts to $5,000.
That means their ROI calculation is:
ROI = (5,000 - 6,500) / 6,500 x 100 = -23.08%
Their ROAS calculation is:
ROAS = 5,000 / 1,500 = 3.33
This particular ad spend was very efficient: They earn more than $3 for each dollar spent on advertising. But due to high costs, the overall business isn’t profitable, and therefore it isn’t scalable, as you can see with a negative ROI.
This is an opportunity for the brand to evaluate where those costs come from, such as inventory, overhead, or operational inefficiencies, and look for opportunities to make improvements that can contribute to a more stable bottom line.
Listen, we’re not knocking ROAS: It’s an important advertising metric to be aware of. But it can’t fix your budget, and it can be especially misleading during sales or other promotional events.
Instead, take a holistic view of your profitability, using multiple metrics. This approach ensures you’re aware of all of your success and all of your opportunities to improve.
A holistic approach also involves qualitative data. “Conversion and occupancy rates are indeed meaningful, but so is understanding what are the most compelling factors that influenced behavior and motivated action (for better or worse),” writes Jonathan Katz, director of Strategic Branding and Global Experience at Boston University School of Hospitality Administration. “Talk with customers; know why they value the brand. Talk with lost customers; know why they chose another option. Talk with internal constituents; make sure they know what the brand stands for and the expectations that customers have of them. Gain insights.”
Here at Triple Whale, we recommend knowing not just your ROAS and ROI, but other figures like cost per click, AOV, LTV, and more. Once you start tracking these metrics, you’ll know how effective your marketing efforts are. Book a demo with one of our strategists to see how Triple Whale can help you identify and improve these crucial figures.
Return on investment, or ROI, measures your profit in the context of all the money you’ve invested in your business. Return on ad spend, or ROAS, measures revenue from a specific advertising campaign. These two calculations are important to track regularly to get a sense of your business’s success, but they’re most effective when used together and in the context of other key metrics.
Triple Whale makes gathering and monitoring this data simple, with our AI-optimized, fully managed data warehouse and streamlined analytics dashboard. Learn more about how we can support you as you calculate your ROI and ROAS, increase your ROAS, and ultimately scale your business for even greater success.
It’s easy to confuse common marketing metrics, especially when you’re trying to keep track of several different (yet similar) acronyms. That’s often the case for folks who are comparing ROI vs. ROAS. And while the two do share some similarities, there are important differences to be aware of, too.
At the highest level, ROI, or return on investment, is the whole pie, or all of the profits from all of your investments in your business. ROAS, or return on ad spend, is just a slice of that pie, specifically the profit generated by every dollar you spend on advertising.
Both are important measures for you to track so you can get the full picture of your success or clearly identify where you have room for improvement. Keep reading for everything you need to know about the difference between ROI and ROAS and how these two figures can help you understand campaign performance, scale your marketing efforts, and ultimately improve profitability.
Definition: Return on investment, or ROI, is a marketing metric that measures the profit you made from everything you’ve invested in your business.
Formula: To calculate ROI, divide your net profit by the cost of your investment. Then, multiply that number by 100 so your ROI is expressed as a percentage, according to Harvard Business School.
ROI = (Net Profit / Cost of Investment) x 100
‘Good’ ROI: A “good” ROI varies, depending on your industry, goals, and profit margins, among other factors. But generally speaking, many marketers consider an ROI of 200% or higher to be solid, and 500% or higher to be exceptional.
Best for: ROI is most useful for understanding whether your entire marketing strategy is working. It tells you if your business decision-making has been sound so far, and if you’re continuing down the path of profitability.
Definition: What does ROAS stand for? ROAS, or return on ad spend, is a marketing metric that evaluates how effective a specific advertising campaign or strategy is. Rather than looking at total profitability, like ROI, ROAS narrows in on one component of your business’s success.
Formula: To calculate ROAS, divide your ad campaign's total revenue by the total cost you spent on it. Here’s how to find ROAS:
ROAS = Revenue from ads / Cost of ads
This process is the same no matter which channel you’re looking at. For example, you would still calculate your Facebook ROAS using this formula, you would just only include the revenue generated from Facebook ads and the cost of running that campaign. Other platforms allow you to set a specific ROAS you want to hit, such as Google’s target ROAS, an Automated Smart Bidding strategy.
‘Good’ ROAS: A “good” ROAS is considered by many marketers to be 2 or higher, although others push for 4 or higher. This value varies so much, depending on factors like business objectives and profit margins, that here at Triple Whale, we actually believe there is no universal good ROAS.
For example, startups may need a higher ROAS to cover costs and achieve financial growth, while established companies can succeed with a lower ROAS. In determining your own “good” ROAS, you may also want to figure out your breakeven ROAS, or when you break even on acquiring a customer.
Best for: ROAS is most useful for understanding how well a particular ad campaign or channel is working. It lets you know if your marketing channels are worth the investment or not.
The metric can also be used to compare one marketing campaign with another to help you identify which one of them is performing better.
There are quite a few differences between ROAS and ROI. It’s important to know these differences, but also to track both these metrics. Your ROAS lets you know if a campaign has been successful in creating clicks, impressions, and revenue. What ROAS fails to reveal is whether your paid ads department is profitable for the company. This is where ROI steps in.
Here are five big differences in ROAS vs. ROI.
Perhaps the most important difference between ROI and ROAS to be aware of is simply the different perspective these two metrics take.
The insight you’ll take away from knowing and monitoring your ROI is your total revenue.
The insight you learn from calculating your ROAS, on the other hand, is your revenue for a specific ad campaign.
Those insights map naturally to differences in perspective when comparing ROI vs. ROAS. Because ROI tells you your total revenue, it provides a top-level, big-picture perspective on the effectiveness of your business.
ROAS takes a narrower, more focused perspective of marketing effectiveness by measuring the profitability of one particular campaign.
Take another look at the formulas above for ROI and ROAS. Notice that you calculate your ROI using your net profit, meaning it evaluates your profitability after accounting for all of your expenses.
ROAS, on the other hand, only looks at the revenue from a specific campaign in respect to how much you spent on that campaign.
As such, the costs that are factored into identifying your ROI or your ROAS differ, too.
Your ROAS only looks at the marketing spend for the particular campaign you’re evaluating. But ROI considers all the costs associated with running your entire brand, including salaries for employees, subscriptions for tools, shipping, storage, production, customer acquisition cost, and other business expenses.
Both ROI and ROAS are important metrics to monitor for your ongoing success.
But if ROAS is the only metric you calculate, the results will be misleading because ROAS only takes into account your advertising costs. You may have optimized your ROAS, but if you’re not also increasing your ROI, you may still need to improve other areas of your business to make a profit. ROI alone can be a reliable measure of your business’s overall performance, but you shouldn’t use ROAS alone for this type of analysis.
Use ROI if you want a high-level snapshot of your business’s overall profitability.
Use ROAS if you’re looking for the effectiveness of a particular campaign and opportunities to optimize your short-term strategy.
That said, your best bet is to use both, for a well-rounded assessment of your performance.
Let’s take a look at some examples that will help put these calculations into context.
A coffee ecommerce business runs digital advertising campaigns mainly on Google Ads and Instagram to acquire new customers.
Their total investment is $20,000. Their total revenue is $35,000.
That means their ROI calculation is as follows:
ROI = (35,000 - 20,000) / 20,000 x 100 = 75%
They spent $8,000 on ads and made $24,000 in revenue attributed to those ads. That means their ROAS calculation is:
ROAS = 24,000 / 8,000 = 3
These metrics point to financial efficiency for this business: The positive ROI means the coffee company is generating more revenue than its total investment, and the positive ROAS shows its ad campaigns are returning three times what they cost. These marketers will want to keep doing what they’re doing!
Now let’s imagine the same company above only made $15,000 in total revenue, $6,000 of which is attributed to ads. This scenario changes their ROI calculation to:
ROI = (15,000 - 20,000) / 20,000 x 100 = -25%
And it changes their ROAS formula to:
ROAS = 6,000 / 8,000 = 0.75
You’ll see their ROAS isn’t technically a negative number, but they’re not breaking even: For every dollar they spent on ads, they only earned 75 cents, so they’re losing money.
And coupled with an overall negative ROI, they’re going to want to evaluate which ads aren’t working, come up with hypotheses as to why, test alternatives, and recalculate these metrics to measure their improvement. Sometimes profitability requires this kind of constant cycle of iteration!
It’s also possible, however, for a particular ad campaign to underperform, while your business stays profitable.
For example, a productivity company sells an app for $20 per month, and most of their customers find them organically through SEO and referrals. After launching an ad campaign, their total spend comes to $8,000, and $2,000 of that was on ads.
Their total revenue is $10,000, and they determine $600 is from ads.
That means their ROI calculation is as follows:
ROI = (10,000 - 8,000) / 8,000 x 100 = 25%
Their ROAS calculation, on the other hand, paints a different picture:
ROAS = 600 / 2,000 = 0.3
This business’s ROAS is undesirable, as they’re only making 30 cents on every dollar they spent on their ad campaign. But because their organic channels are so efficient, the overall business remains profitable, as reflected by their positive ROI.
This is an opportunity for the brand to analyze their underperforming ads and test changes. But depending on their goals and priorities, they may also decide to double down on the channels that already perform well for them and focus on conversion rate optimization instead, for example.
Then, there may be instances where an ad campaign is profitable but an overall business is not.
Consider an online dropshipping store that sells phone accessories. Paid ads drive all of their sales. Their total costs come to $6,500, and $1,500 of that is ad spend. Their revenue amounts to $5,000.
That means their ROI calculation is:
ROI = (5,000 - 6,500) / 6,500 x 100 = -23.08%
Their ROAS calculation is:
ROAS = 5,000 / 1,500 = 3.33
This particular ad spend was very efficient: They earn more than $3 for each dollar spent on advertising. But due to high costs, the overall business isn’t profitable, and therefore it isn’t scalable, as you can see with a negative ROI.
This is an opportunity for the brand to evaluate where those costs come from, such as inventory, overhead, or operational inefficiencies, and look for opportunities to make improvements that can contribute to a more stable bottom line.
Listen, we’re not knocking ROAS: It’s an important advertising metric to be aware of. But it can’t fix your budget, and it can be especially misleading during sales or other promotional events.
Instead, take a holistic view of your profitability, using multiple metrics. This approach ensures you’re aware of all of your success and all of your opportunities to improve.
A holistic approach also involves qualitative data. “Conversion and occupancy rates are indeed meaningful, but so is understanding what are the most compelling factors that influenced behavior and motivated action (for better or worse),” writes Jonathan Katz, director of Strategic Branding and Global Experience at Boston University School of Hospitality Administration. “Talk with customers; know why they value the brand. Talk with lost customers; know why they chose another option. Talk with internal constituents; make sure they know what the brand stands for and the expectations that customers have of them. Gain insights.”
Here at Triple Whale, we recommend knowing not just your ROAS and ROI, but other figures like cost per click, AOV, LTV, and more. Once you start tracking these metrics, you’ll know how effective your marketing efforts are. Book a demo with one of our strategists to see how Triple Whale can help you identify and improve these crucial figures.
Return on investment, or ROI, measures your profit in the context of all the money you’ve invested in your business. Return on ad spend, or ROAS, measures revenue from a specific advertising campaign. These two calculations are important to track regularly to get a sense of your business’s success, but they’re most effective when used together and in the context of other key metrics.
Triple Whale makes gathering and monitoring this data simple, with our AI-optimized, fully managed data warehouse and streamlined analytics dashboard. Learn more about how we can support you as you calculate your ROI and ROAS, increase your ROAS, and ultimately scale your business for even greater success.
.webp)

Body Copy: The following benchmarks compare advertising metrics from April 1-17 to the previous period. Considering President Trump first unveiled his tariffs on April 2, the timing corresponds with potential changes in advertising behavior among ecommerce brands (though it isn’t necessarily correlated).


.webp)

.webp)


.png)


.png)
.png)
.png)