


You open your attribution dashboard and see a 3.2x ROAS. Strong — but is it actually good for a brand like yours? A 3x ROAS can be top-tier in one category and below average in another.
Without context, performance data is hard to act on. Ads Benchmarks gives you that context — right inside Triple Whale Attribution.
Ads Benchmarks is a new feature inside Triple Whale Attribution that compares your channel performance against a dynamic peer group of ecommerce brands that operate like yours — not generic industry averages.
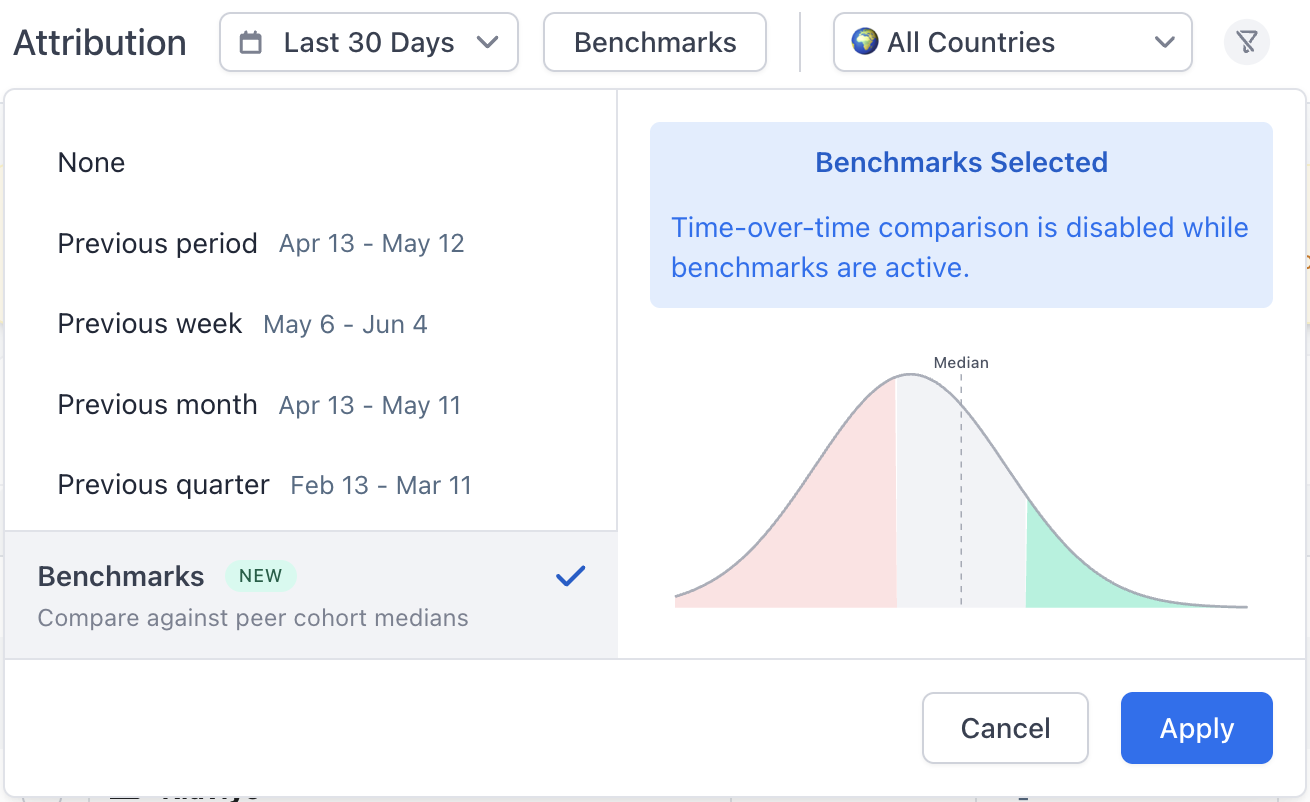
It surfaces real-time benchmarks directly in your Attribution page across the metrics that shape spend decisions, such as:
For each metric, you can see whether you're in the top 25%, at median, or in the bottom 25% for your peer group — across Meta, Google, TikTok, and more.
This only works because of the scale and structure behind Triple Whale’s data.
60,000 brands worth of data
Every benchmark is an anonymized, cross-brand median computed from a dataset of 60,000+ ecommerce brands connected to Triple Whale.
The raw data is structured at a granular level — one row per shop, per day, per channel — which allows us to normalize performance across channels and time, then group brands into cohorts.
Psst: We think you'd like the 2026 Health & Beauty Benchmarks Report
Matched to brands like yours
Brands are matched using signals like industry, revenue band, AOV, and ad channel mix. All monetary values are normalized to USD before aggregation so comparisons hold across markets.
Medians, not averages
Ecommerce performance is highly skewed. A small number of extreme performers can distort averages and create misleading "typical" benchmarks.
The median reflects the actual middle of the market — half of similar brands perform above it, half below. Percentile bands let you see the full distribution, not just a single point of comparison.
Privacy at every layer
No individual store or brand is ever exposed. Only aggregated, cohort-level statistics are surfaced. A strict minimum cohort size is applied before any benchmark appears. If a cohort is too small, it rolls up to a broader group rather than risk surfacing identifiable data.
Attribution tells you what happened. Benchmarks tell you how it compares. Here's what that looks like in practice:
See where you rank
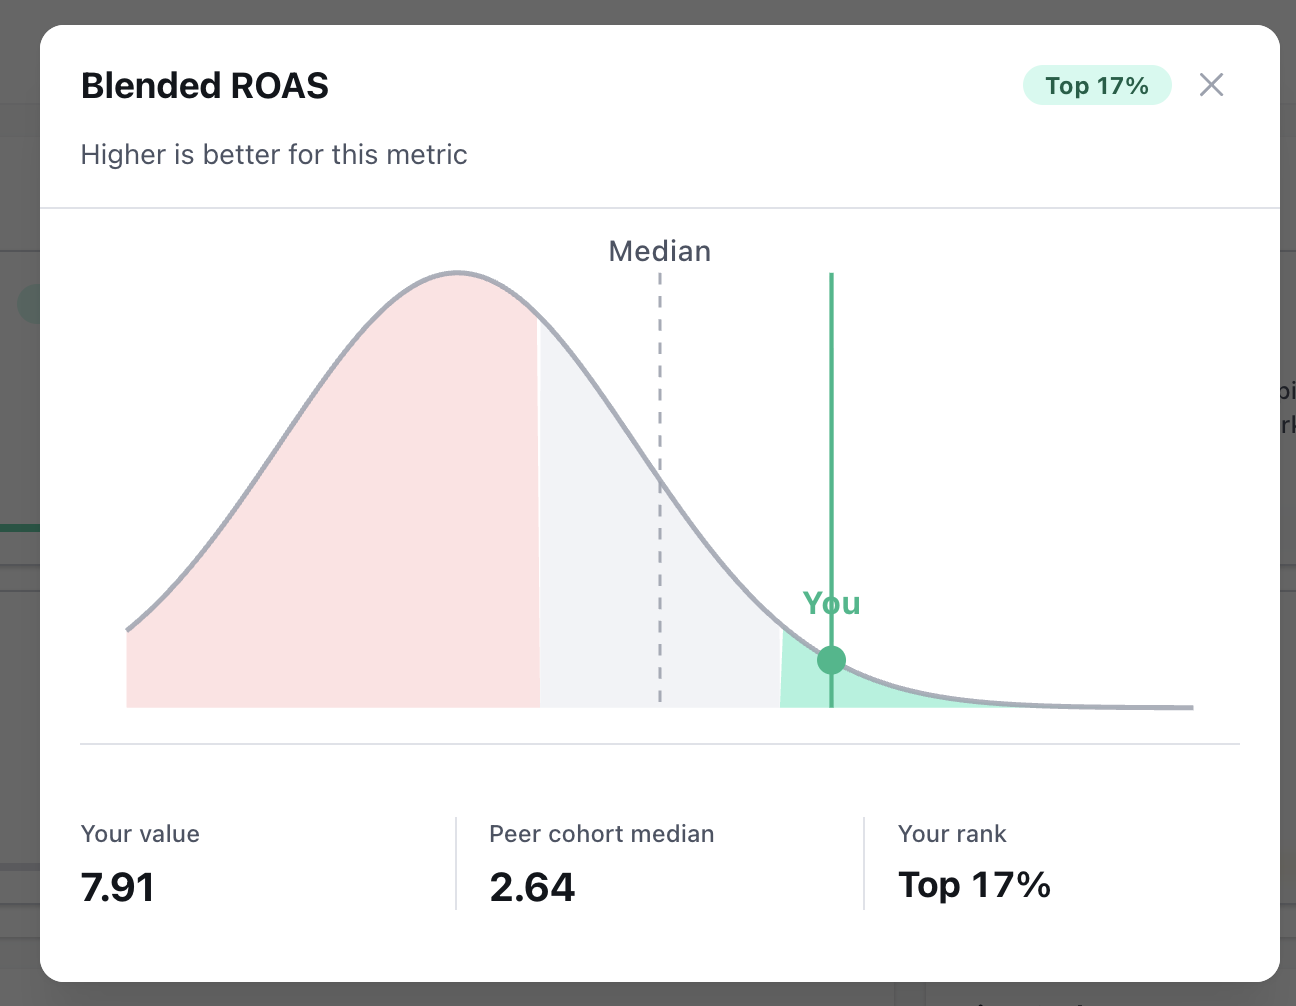
For every key metric — Blended ROAS, CPA, CPM, CTR, New Customer %, and AOV — you'll see a direct % number that showcases where you stack up within your peer group. Not a vague "industry average."
Compare across channels
Benchmarks surface across Meta, Google, TikTok, and more — so you can spot where you're outperforming on one channel and underperforming on another, and prioritize accordingly.
Know what deserves attention
When a metric dips, it's not always a problem. Benchmarks give you the context to tell the difference between a real gap and normal variance for brands like yours.
Stop second-guessing
Ads Benchmarks helps answer the questions that shape spend decisions, like:
Already a Triple Whale customer on the Automate plan?
Ads Benchmarks is available now, directly inside your Attribution page. Head to your attribution dashboard to explore your benchmarks.
On a Foundation or legacy plan?
Ads Benchmarks is available on the Automate plan. Talk to your CSM to learn how to unlock it.
Not a Triple Whale customer yet?
Start with the free tool. Enter your industry, revenue range, and AOV to get an instant performance baseline against your industry peers — no account required.
Try the free Benchmark Tool today
You open your attribution dashboard and see a 3.2x ROAS. Strong — but is it actually good for a brand like yours? A 3x ROAS can be top-tier in one category and below average in another.
Without context, performance data is hard to act on. Ads Benchmarks gives you that context — right inside Triple Whale Attribution.
Ads Benchmarks is a new feature inside Triple Whale Attribution that compares your channel performance against a dynamic peer group of ecommerce brands that operate like yours — not generic industry averages.
It surfaces real-time benchmarks directly in your Attribution page across the metrics that shape spend decisions, such as:
For each metric, you can see whether you're in the top 25%, at median, or in the bottom 25% for your peer group — across Meta, Google, TikTok, and more.
This only works because of the scale and structure behind Triple Whale’s data.
60,000 brands worth of data
Every benchmark is an anonymized, cross-brand median computed from a dataset of 60,000+ ecommerce brands connected to Triple Whale.
The raw data is structured at a granular level — one row per shop, per day, per channel — which allows us to normalize performance across channels and time, then group brands into cohorts.
Psst: We think you'd like the 2026 Health & Beauty Benchmarks Report
Matched to brands like yours
Brands are matched using signals like industry, revenue band, AOV, and ad channel mix. All monetary values are normalized to USD before aggregation so comparisons hold across markets.
Medians, not averages
Ecommerce performance is highly skewed. A small number of extreme performers can distort averages and create misleading "typical" benchmarks.
The median reflects the actual middle of the market — half of similar brands perform above it, half below. Percentile bands let you see the full distribution, not just a single point of comparison.
Privacy at every layer
No individual store or brand is ever exposed. Only aggregated, cohort-level statistics are surfaced. A strict minimum cohort size is applied before any benchmark appears. If a cohort is too small, it rolls up to a broader group rather than risk surfacing identifiable data.
Attribution tells you what happened. Benchmarks tell you how it compares. Here's what that looks like in practice:
See where you rank
For every key metric — Blended ROAS, CPA, CPM, CTR, New Customer %, and AOV — you'll see a direct % number that showcases where you stack up within your peer group. Not a vague "industry average."
Compare across channels
Benchmarks surface across Meta, Google, TikTok, and more — so you can spot where you're outperforming on one channel and underperforming on another, and prioritize accordingly.
Know what deserves attention
When a metric dips, it's not always a problem. Benchmarks give you the context to tell the difference between a real gap and normal variance for brands like yours.
Stop second-guessing
Ads Benchmarks helps answer the questions that shape spend decisions, like:
Already a Triple Whale customer on the Automate plan?
Ads Benchmarks is available now, directly inside your Attribution page. Head to your attribution dashboard to explore your benchmarks.
On a Foundation or legacy plan?
Ads Benchmarks is available on the Automate plan. Talk to your CSM to learn how to unlock it.
Not a Triple Whale customer yet?
Start with the free tool. Enter your industry, revenue range, and AOV to get an instant performance baseline against your industry peers — no account required.
Try the free Benchmark Tool today


Body Copy: The following benchmarks compare advertising metrics from April 1-17 to the previous period. Considering President Trump first unveiled his tariffs on April 2, the timing corresponds with potential changes in advertising behavior among ecommerce brands (though it isn’t necessarily correlated).


.webp)

.webp)

.png)

.png)


.png)
