


Calculating your average order value (AOV) is deceptively simple: The formula is only one line and it only requires two numbers!
But things get a little more complicated when it comes to actually gathering those inputs, choosing what time period to calculate AOV for, and deciding how to interpret your results.
Keep reading for a deep dive on the AOV formula and how to use it most effectively.
Key takeaways
Before you can learn how to calculate AOV, it helps to really understand the formula.
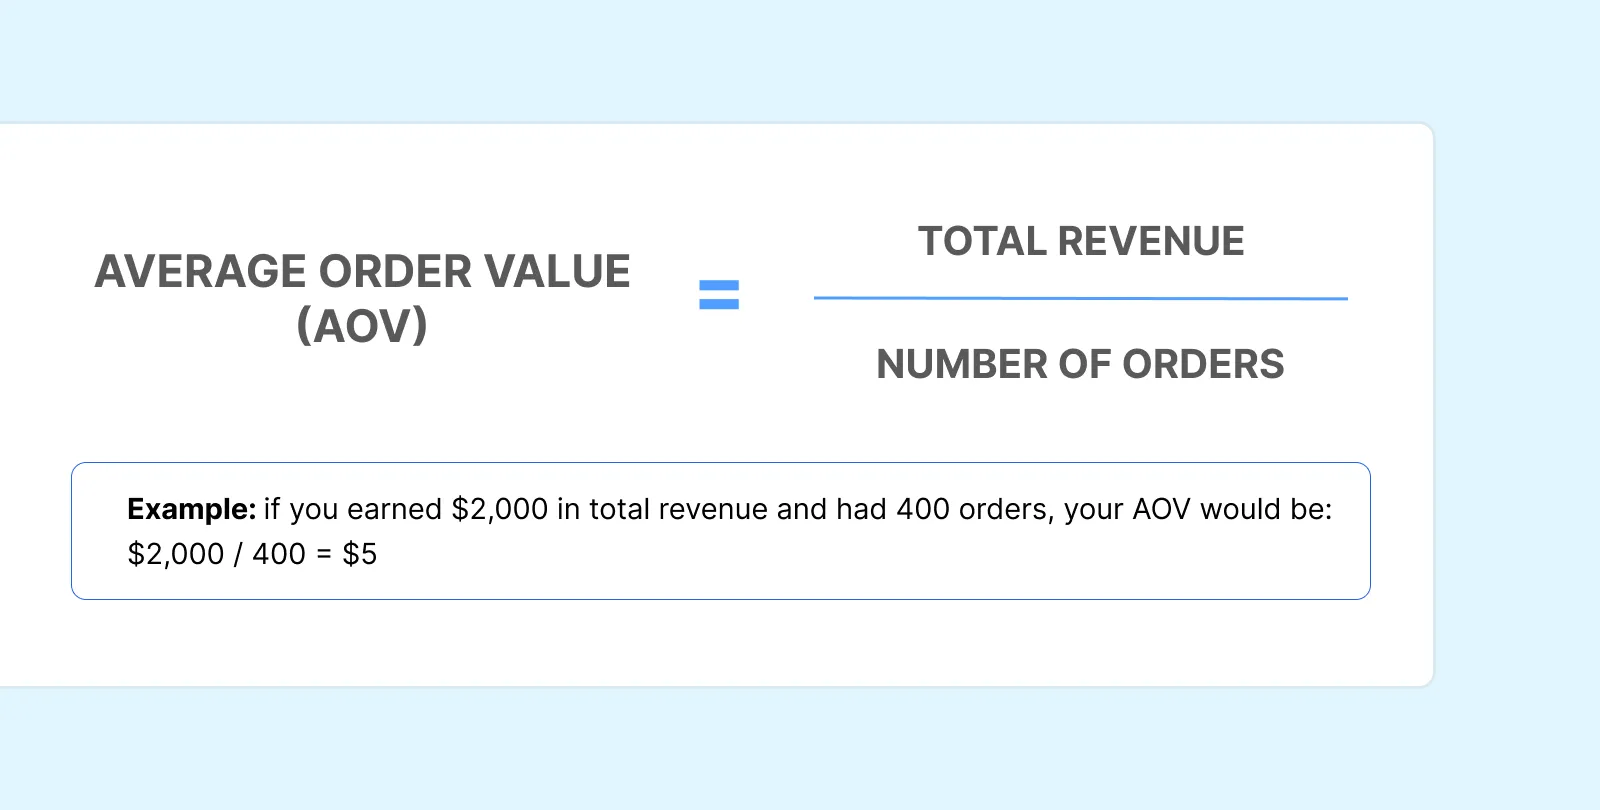
The formula for average order value is a ratio of two specific inputs, net revenue and order count, over a defined time period.
AOV = total revenue / total number of orders
The result is a dollar amount — the average a customer spends with your brand per order. Generally speaking, increasing this number is a good thing. Considering the global ecommerce market is expected to grow to $6.8 trillion by 2028, according to Forrester research, you want to capture as many of those dollars as possible.
But you won’t know where you stand — because your AOV calculation won’t be reliable — unless you’ve defined all three components of the formula correctly.
Let’s take a closer look at each of those components before walking through an example of how this all works in practice.
AOV formula inputs at a glance:
The correct revenue input for your AOV calculation is net revenue. This means it’s your gross sales minus any expenses over your selected time period.
Do not include refunds, returns, promotional discounts applied at the order level, shipping costs, or taxes in your net revenue number. Those should all be subtracted from your gross sales first.
Keeping those amounts in can seriously skew your AOV. Using the wrong revenue number is one of the most common AOV errors, so make sure you’re finding your true total revenue number before working through the calculation.
Your input for the number of orders in the AOV formula should be all the completed, paid transactions that fall within your selected time period — not sessions, not carts, not abandoned checkouts.
Do not include cancelled or fully refunded orders. Those should be excluded just like refunded revenue is excluded from your total revenue number. If you left in refunded or cancelled orders, you’ll get skewed results.
AOV is only meaningful when you explicitly define your selected time frame and then consistently apply it to your calculation. Comparing a seven-day AOV to a 30-day AOV is like, as the saying goes, comparing apples to oranges. Your calculations need to be consistent if you’re going to use the results to come to any meaningful conclusions.
Seasonality will naturally change your AOV relative to your baseline AOV. For example, maybe Q4 is naturally slower for you or maybe Black Friday and Cyber Monday sales drive much higher revenue than usual. Either way, time period labeling is essential to understanding your AOV and what it says about the health of your business.
Now let’s break down how to calculate your AOV in ecommerce.
You’ll start by pulling your net sales (not your gross sales) from your ecommerce platform for your defined time period. Make sure to confirm that refunds and returns have already been subtracted from this revenue number.
For example, let’s say you’re going to look at the last 30 days. During that 30-day window, your dashboard shows your business made $55,000 in net revenue.
Next, pull the total number of paid, fulfilled orders for the same 30-day window. Remember, this is not sessions, not unique customers, not carts or line items. It’s completed orders.
Sticking with our 30-day window, let’s say you fielded 1,500 orders.
Now, divide the first number by the second number.
In our example above, your AOV calculation is:
55,000 / 1,500 = 36.67
That means, on average, a customer spends nearly $37 with your brand per order.
Before you make any big decisions: This number gives you a starting point from which you can analyze the health of your business. To really interpret it thoughtfully, you still need a little more context, which we’ll cover in the segmentation and benchmarking sections below.
Let’s take a look at how this actually works in practice, across three different examples. Of course, the formula stays the same in each scenario, but you’ll see how the strategic purpose of the AOV calculation — and what counts as a meaningful result — differs depending on the business context.
A new ecommerce startup in its early months wants to establish a baseline AOV before making any changes. This way, the business can establish a baseline AOV to use as a reference point in the future. Marketers will be able to compare AOV after implementing any optimization strategies to this baseline number to see if those campaigns and tactics are working.
Total revenue, first 30 days of business: $12,500
Total orders, first 30 days of business: 250
AOV = 12,500 / 250 = $50
This company’s baseline AOV is $50. After making changes, the team will be able to easily identify if AOV increases or decreases from there.
An established retail brand wants to compare AOV during their Black Friday/Cyber Monday campaign to the prior month to see if their seasonal campaign was profitable.
AOV is higher for this brand during their seasonal campaign, but this doesn’t tell them everything they need to know about profit at face value. Higher seasonal AOV doesn’t automatically translate to profit if you’re not also looking at your costs.
For example, if customer acquisition cost (CAC) spikes due to aggressive paid media to promote your seasonal campaign and contribution margin shrinks from discounts or free shipping, each order may actually generate less profit (or even loss) despite a higher AOV.
A business runs a major sale that’s a big hit for completed transactions, but it ends up resulting in a lot of returns.
Total revenue during 30-day sale: $80,000
Total orders during 30-day sale: 1,000
Refunded value: $16,000
Refunded orders: 150
If this brand only calculated their gross AOV, they’d get the following result:
AOV = 80,000 / 1,000 = $80
But if they first subtract the refunds, they’d get:
AOV = (80,000 - 16,000) / (1,000 - 150) = 64,000 / 850 = $75.29
As you can see, not subtracting the refunded revenue and orders inflates AOV. That, in turn, can affect the decisions a brand might make in the future about ad spend or free shipping thresholds, for example.
The examples above might start to tip you off to some of the common mistakes brands make when they calculate AOV. But there’s good news: These missteps are easy to make, but they’re also easy to fix. Here’s how to double-check your own calculations quickly.
Collecting shipping revenue at checkout inflates your revenue number in your AOV calculation, but it doesn’t reflect actual product value. Your AOV should only measure what customers spend on merchandise, not logistics fees.
This is usually a line item in your platform reports, and it typically excludes shipping. Use this number instead of total collected revenue.
Tax collected isn’t revenue; it goes to the government and has no bearing on order value. Again, your AOV should focus solely on merchandising and marketing.
Make sure the figures for "net sales" or "product revenue" in your platform exclude tax before using these in your AOV formula.
If your revenue number includes unprocessed refunds, you’re overstating what customers actually kept and paid for. That can lead to an inaccurate AOV.
Calculate your AOV using your net revenue, or your gross sales minus any refunds and other costs. Exclude any fully refunded orders from your order count, too. Your AOV is most accurate when you make both of these adjustments together. Keep in mind this may result in a lower or a higher AOV: Sometimes returns remove lower-value orders.
Comparing AOVs calculated from mismatched time periods simply doesn’t work. For example, looking at a seven-day Black Friday/Cyber Monday AOV to 30 days in, say, March, doesn’t really tell you anything useful.
Always label the time period explicitly and compare like-for-like windows, such as the same calendar week year-over-year, the same quarter year-over-year, or 30 days versus the previous 30 days.
There are a lot of ways to get even more detailed analysis out of your AOV. But you’ll miss out on these insights if you’re using a single aggregate AOV across traffic sources, device types, and customer segments. And acting on this blended number can cause you to misallocate your budget.
Before drawing conclusions about specific campaigns or channels, consider segmenting your AOV by traffic source or device type, for example. More on how to do that below!
Here’s the real problem with using a single, blended AOV: It averages data from customers and channels that behave very differently, as you can see in the table below. That means a blended AOV isn’t a great basis for specific decisions about budget allocation, campaign targeting, or product strategy.
How AOV varies by segment — example data
Different acquisition channels attract customers with different purchase intent and price sensitivity, so it can help to understand how your AOV shakes out on different traffic sources.
For example, email traffic typically produces a higher AOV than paid social traffic, because email subscribers already have some brand familiarity.
Say your blended AOV is $50, but email-driven AOV is $74 and paid social AOV is $38. If you blend those two AOV values, you’ll hide that difference and risk misallocating channel budget as a consequence.
Similarly, the devices your customers are using to shop with your business can result in different AOVs. Desktop sessions frequently produce a higher AOV compared to mobile sessions. Multi-item purchases and checkout flows are typically easier to navigate on desktop.
But a big gap in your device-level AOV segments doesn’t mean you should simply accept a lower mobile AOV. Instead, take a hard look at your mobile checkout for opportunities to optimize that experience.
First-time buyers usually have a lower AOV than repeat shoppers because returning customers have more familiarity with your brand and trust in your offerings. Knowing this can help you evaluate the success of your acquisition and retention efforts.
For example, if your new customer AOV is unusually high, your acquisition campaigns are likely attracting high-intent shoppers. If it’s low, your entry-level products may be dominating first purchases. That means it’s time to turn your attention to upselling and cross-selling.
Calculating your AOV for different product categories reveals which lines are driving order value. These insights can help inform decisions about bundling, promotions, and inventory.
Our guide to increasing average order value has all sorts of helpful tips for acting on this kind of category-level AOV data.
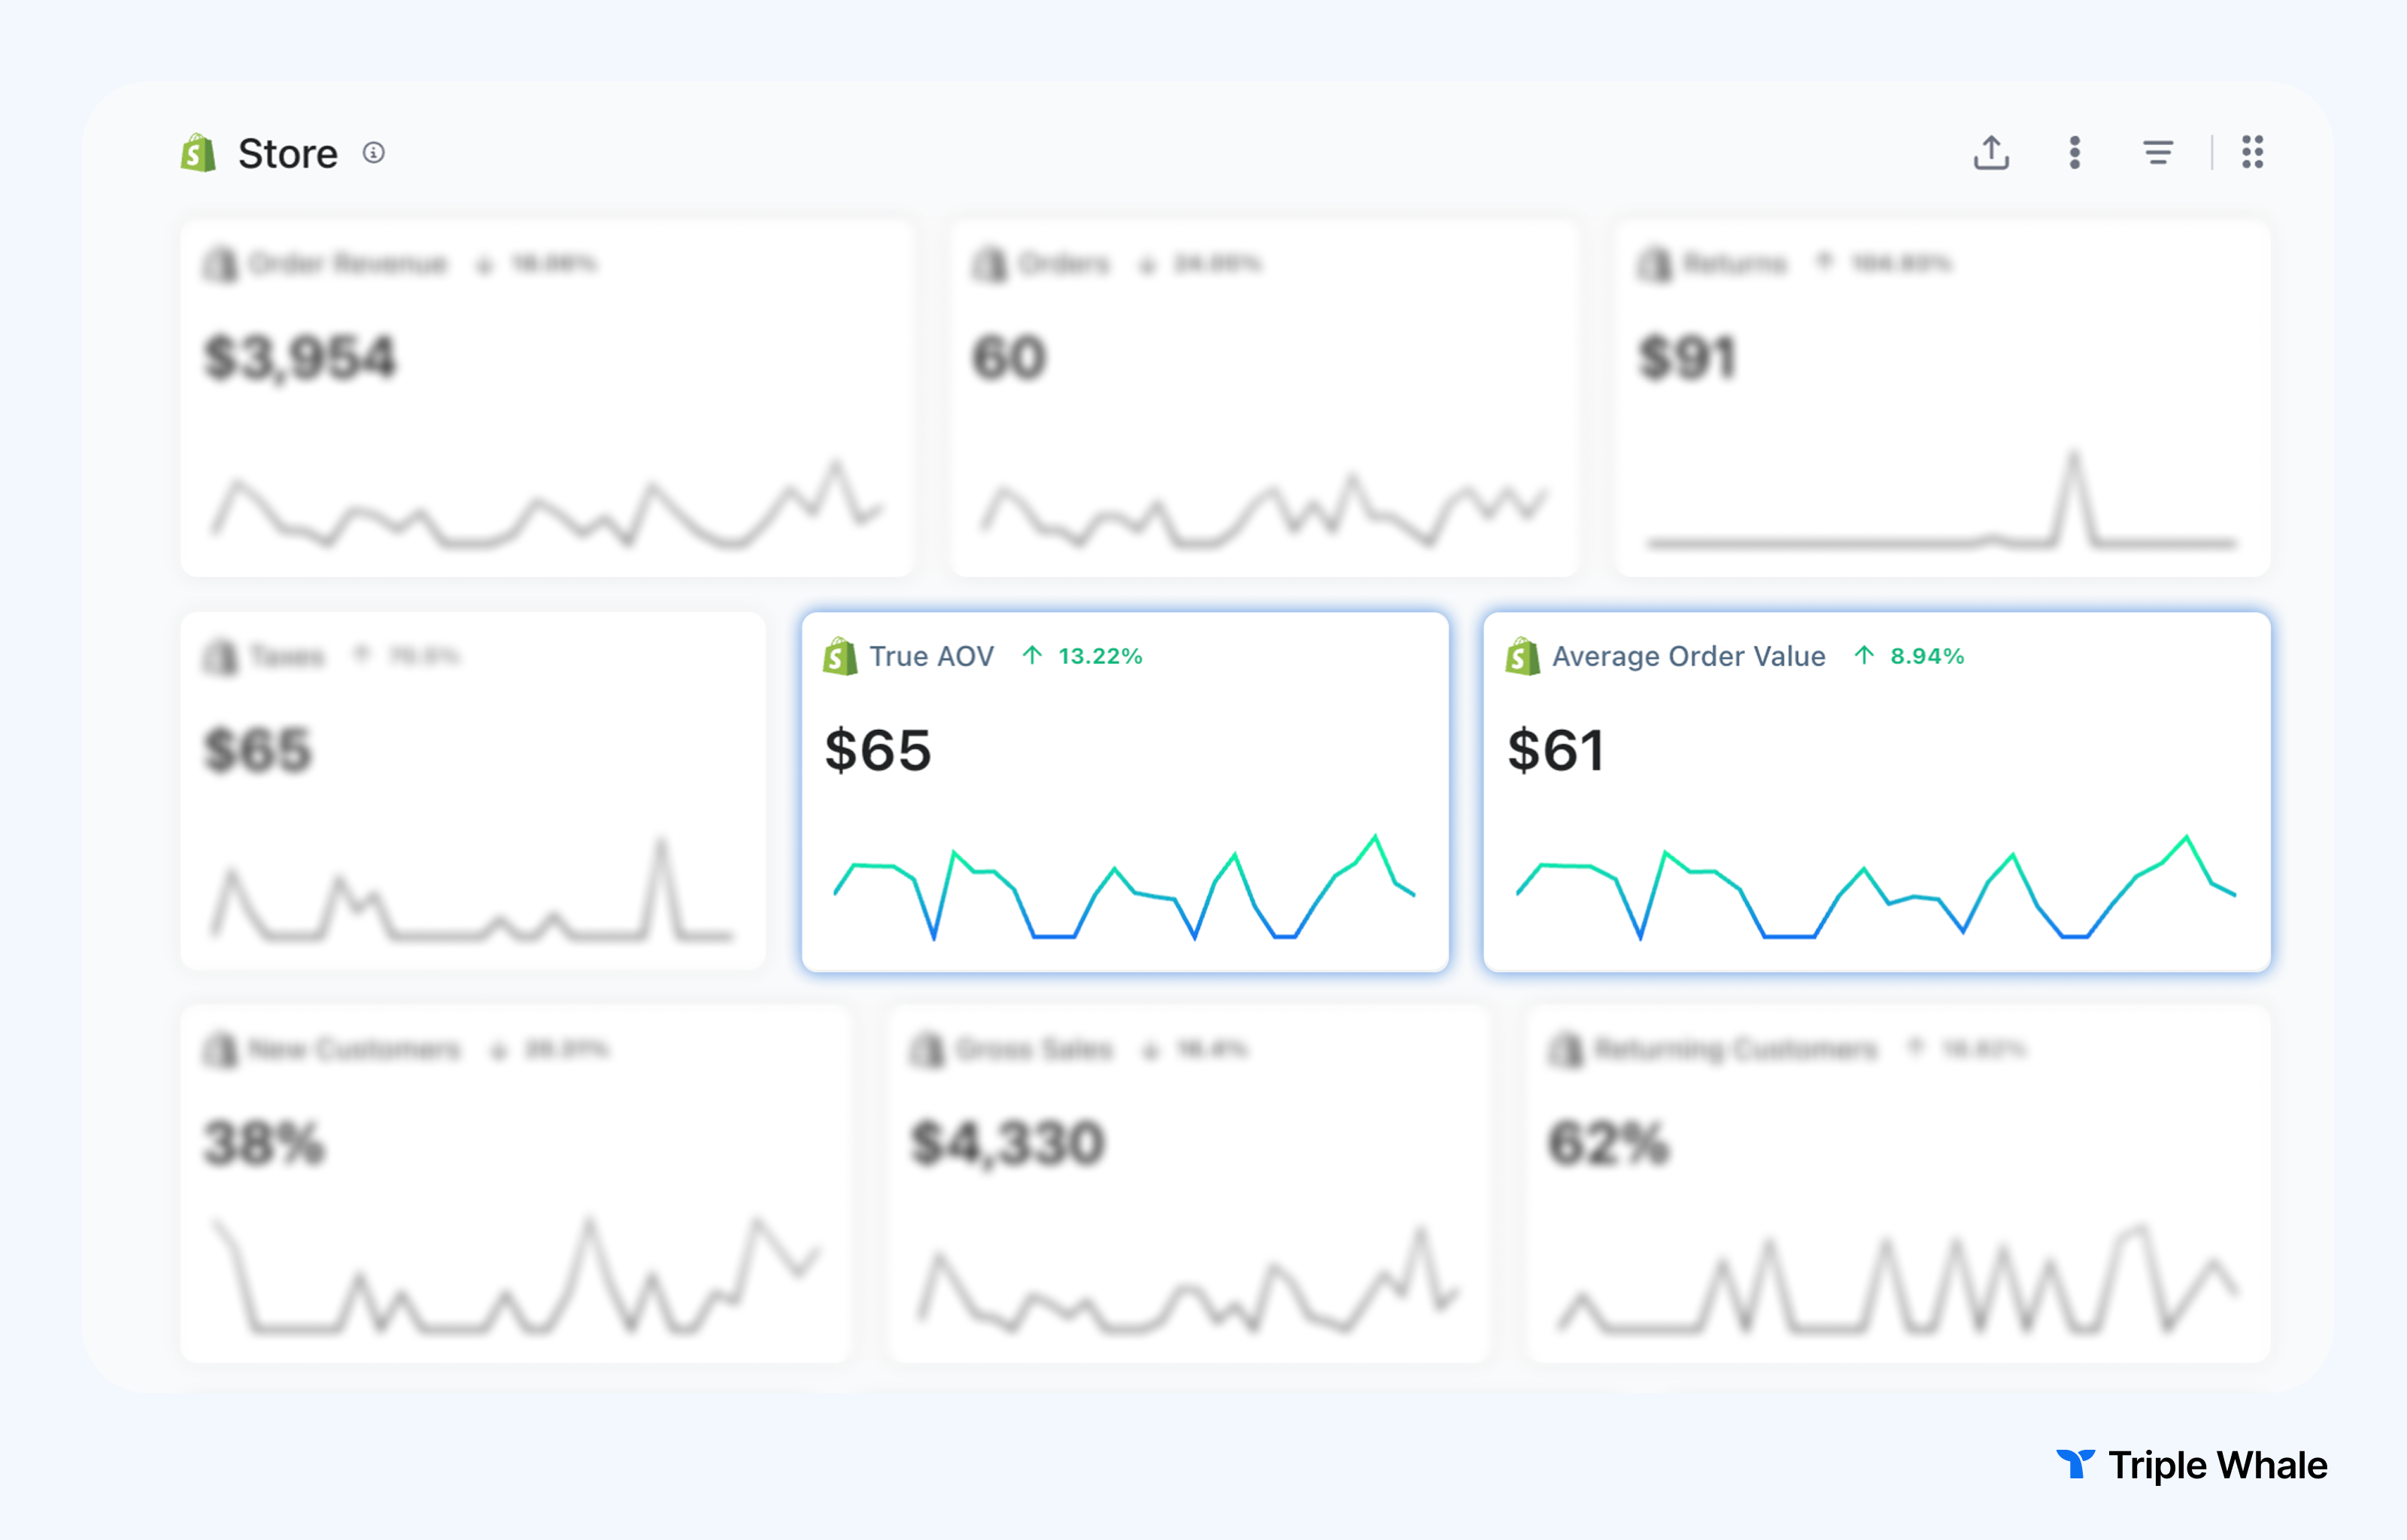
In Shopify, you can monitor AOV directly in your Analytics dashboard or through custom reports.
Desktop
Set the date range to the time period you want to calculate AOV for, such as the last 30 days or the last seven days.
Find the Sales Over Time report, which will spell out your net sales (the revenue figure you should use in your own AOV formula) and your total orders for the time frame you picked.
You’ll often see AOV calculated for you in the Sales Over Time report. If not, you can now do the calculation yourself. Remember: Total revenue / total number of orders = AOV!
The blended stats found in your Custom Metrics section offer a comprehensive snapshot of your business's performance, integrating data from orders, refunds, ads, and custom expenses.
Summary Dashboard → /summary — Best for a quick, high-level AOV snapshot alongside other store KPIs. Pin AOV to your Pinned section so you can instantly see it the moment you arrive — just hover over the metric tile and click the 📌 icon.
Affluencer Hub → /affluencer-hub — Great for comparing AOV across influencer campaigns and discount codes. You can also summarize the top five discount codes by AOV for a given quarter to see which promos are driving higher-value orders.
Product Analytics → /product-analytics — Useful for seeing which products drive higher or lower AOV.
Customer Insights → /ltv — Navigate to the LTV section within Customer Insights to see AOV alongside 60-day and 90-day LTV. You can toggle between the last 3, 6, or 12 months to track historical trends and averages over a larger period.
Benchmarks Dashboard → /benchmarks — Filter benchmark data by AOV segment (orders averaging more or less than $100 USD over the last 90 days) to compare your performance against similar stores across platforms like Google, Meta, and TikTok.
Custom Dashboard — Build a fully customized AOV dashboard by adding data visualizations via drag-and-drop metrics, SQL queries, or by asking Moby in plain language and saving the output directly to a dashboard.
Inside, you may see:
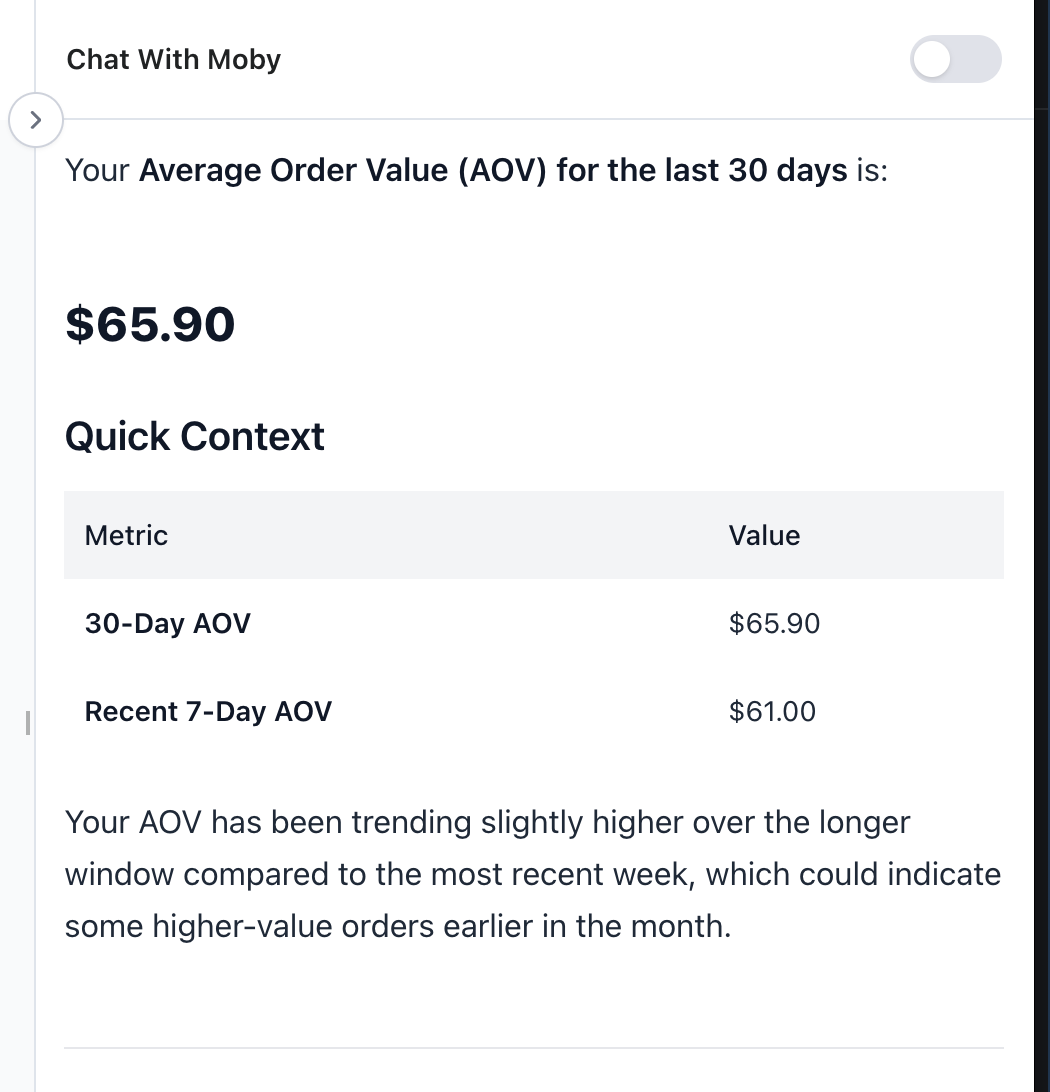
Within Triple Whale, Moby is connected to all of your data. You can chat with Moby, Triple Whale's AI assistant, and simply ask something like "What's my AOV for the last 30 days?"
You can take Moby even further with more advanced prompts:
When Moby pulls data from your warehouse, it creates an out-of-the-box visualization automatically — and you can customize the chart type, axes, and formatting before saving it to any dashboard.
AOV is most useful when you consider it alongside other ecommerce metrics. Keep reading for a brief look at why, and check out our guide to all things AOV for a deeper dive.
A higher AOV generally comes with a higher customer lifetime value, or CLV, because both are measures of the value of a customer. That said, this relationship isn’t automatic: Purchase frequency and retention rate also determine lifetime value, for example. (As a refresher, here’s how to calculate CLV.)
Of course, you want to see a strong AOV and a good conversion rate, but these two metrics can move in opposite directions if tactics like aggressive upselling or a high free shipping threshold end up discouraging some shoppers from completing a transaction. Keeping an eye on both measures helps you spot (and then eliminate) friction as soon as possible.
AOV directly affects your ROAS: That’s because higher order value means each ad-driven conversion generates more return.
But you have to keep an eye on costs, too. You can use your AOV to evaluate whether your current ad spend is sustainable. If your AOV doesn’t cover your acquisition and fulfillment costs, then, while you may be building your audience, you’re doing so at a loss.
In order to keep learning (and improving) from your AOV, you’re going to want to check in on it regularly.
How often you recalculate will come down to your goals and your overall reporting cadence, but here are some time frames to consider.
Monthly AOV calculation will give you enough data to smooth out day-to-day fluctuations while still being frequent enough to catch meaningful trends quickly.
Decide on a consistent date each month to run through the AOV formula, such as the first of each month for the previous 30 days. Then, make this a recurring item on your to-do list or calendar. This keeps you accountable to the process and makes sure all your time period comparisons match up.
When you’re running a promotion or paid media campaign or launching a new product, more frequent AOV calculation — like weekly or even daily — can help you isolate how you’re currently performing compared to your baseline.
Make sure you’re comparing this campaign-period AOV to the equivalent non-campaign period from the previous month or year, not to your overall monthly average. That ensures you’re not accidentally capturing or missing any seasonal effects.
Black Friday/Cyber Monday, back-to-school, Valentine’s Day, and other seasonal shopping events can be standouts for certain businesses. If that’s you, then your most meaningful AOV comparison will be to the same period during the previous year, not the previous month. You want to know that your efforts this Black Friday exceeded your efforts last Black Friday, in other words.
Make sure you’re labeling your year-over-year AOV comparisons clearly in all your reporting so other team members and stakeholders know exactly what they’re looking at.
Whether you're monitoring daily performance on the Summary Dashboard, analyzing which products or discount codes drive higher-value orders, Triple Whale gives you multiple ways to track, segment, and act on your AOV data.
Want to see how Triple Whale can help your brand grow AOV and overall profitability? Book a demo today.
Your gross revenue is all the money you made over a set period of time. Your net revenue is that gross revenue minus any costs over that same time period, such as refunds, returns, discounts, shipping, and taxes. You should be using net revenue in the AOV formula.
Always make sure you’re subtracting refunded revenue and refunded orders before calculating your AOV. Otherwise, you may get an incorrect AOV, which can throw off budget and campaign decisions.
Because different traffic sources attract potential customers with different familiarity with your brand, price sensitivity, and purchase intent. Shoppers who come to your site through paid social may not be as likely to convert than those who come through email, for example.
You can use the same formula in your spreadsheet of choice to calculate AOV.
First, find your total revenue and your total number of orders. Enter total revenue in column A, cell 1. Enter total orders in column B, cell 1.
In column C, enter the formula “=A1/B1” and hit “Enter”. Column C, cell 1 will now display your AOV.
Calculating your average order value (AOV) is deceptively simple: The formula is only one line and it only requires two numbers!
But things get a little more complicated when it comes to actually gathering those inputs, choosing what time period to calculate AOV for, and deciding how to interpret your results.
Keep reading for a deep dive on the AOV formula and how to use it most effectively.
Key takeaways
Before you can learn how to calculate AOV, it helps to really understand the formula.
The formula for average order value is a ratio of two specific inputs, net revenue and order count, over a defined time period.
AOV = total revenue / total number of orders
The result is a dollar amount — the average a customer spends with your brand per order. Generally speaking, increasing this number is a good thing. Considering the global ecommerce market is expected to grow to $6.8 trillion by 2028, according to Forrester research, you want to capture as many of those dollars as possible.
But you won’t know where you stand — because your AOV calculation won’t be reliable — unless you’ve defined all three components of the formula correctly.
Let’s take a closer look at each of those components before walking through an example of how this all works in practice.
AOV formula inputs at a glance:
The correct revenue input for your AOV calculation is net revenue. This means it’s your gross sales minus any expenses over your selected time period.
Do not include refunds, returns, promotional discounts applied at the order level, shipping costs, or taxes in your net revenue number. Those should all be subtracted from your gross sales first.
Keeping those amounts in can seriously skew your AOV. Using the wrong revenue number is one of the most common AOV errors, so make sure you’re finding your true total revenue number before working through the calculation.
Your input for the number of orders in the AOV formula should be all the completed, paid transactions that fall within your selected time period — not sessions, not carts, not abandoned checkouts.
Do not include cancelled or fully refunded orders. Those should be excluded just like refunded revenue is excluded from your total revenue number. If you left in refunded or cancelled orders, you’ll get skewed results.
AOV is only meaningful when you explicitly define your selected time frame and then consistently apply it to your calculation. Comparing a seven-day AOV to a 30-day AOV is like, as the saying goes, comparing apples to oranges. Your calculations need to be consistent if you’re going to use the results to come to any meaningful conclusions.
Seasonality will naturally change your AOV relative to your baseline AOV. For example, maybe Q4 is naturally slower for you or maybe Black Friday and Cyber Monday sales drive much higher revenue than usual. Either way, time period labeling is essential to understanding your AOV and what it says about the health of your business.
Now let’s break down how to calculate your AOV in ecommerce.
You’ll start by pulling your net sales (not your gross sales) from your ecommerce platform for your defined time period. Make sure to confirm that refunds and returns have already been subtracted from this revenue number.
For example, let’s say you’re going to look at the last 30 days. During that 30-day window, your dashboard shows your business made $55,000 in net revenue.
Next, pull the total number of paid, fulfilled orders for the same 30-day window. Remember, this is not sessions, not unique customers, not carts or line items. It’s completed orders.
Sticking with our 30-day window, let’s say you fielded 1,500 orders.
Now, divide the first number by the second number.
In our example above, your AOV calculation is:
55,000 / 1,500 = 36.67
That means, on average, a customer spends nearly $37 with your brand per order.
Before you make any big decisions: This number gives you a starting point from which you can analyze the health of your business. To really interpret it thoughtfully, you still need a little more context, which we’ll cover in the segmentation and benchmarking sections below.
Let’s take a look at how this actually works in practice, across three different examples. Of course, the formula stays the same in each scenario, but you’ll see how the strategic purpose of the AOV calculation — and what counts as a meaningful result — differs depending on the business context.
A new ecommerce startup in its early months wants to establish a baseline AOV before making any changes. This way, the business can establish a baseline AOV to use as a reference point in the future. Marketers will be able to compare AOV after implementing any optimization strategies to this baseline number to see if those campaigns and tactics are working.
Total revenue, first 30 days of business: $12,500
Total orders, first 30 days of business: 250
AOV = 12,500 / 250 = $50
This company’s baseline AOV is $50. After making changes, the team will be able to easily identify if AOV increases or decreases from there.
An established retail brand wants to compare AOV during their Black Friday/Cyber Monday campaign to the prior month to see if their seasonal campaign was profitable.
AOV is higher for this brand during their seasonal campaign, but this doesn’t tell them everything they need to know about profit at face value. Higher seasonal AOV doesn’t automatically translate to profit if you’re not also looking at your costs.
For example, if customer acquisition cost (CAC) spikes due to aggressive paid media to promote your seasonal campaign and contribution margin shrinks from discounts or free shipping, each order may actually generate less profit (or even loss) despite a higher AOV.
A business runs a major sale that’s a big hit for completed transactions, but it ends up resulting in a lot of returns.
Total revenue during 30-day sale: $80,000
Total orders during 30-day sale: 1,000
Refunded value: $16,000
Refunded orders: 150
If this brand only calculated their gross AOV, they’d get the following result:
AOV = 80,000 / 1,000 = $80
But if they first subtract the refunds, they’d get:
AOV = (80,000 - 16,000) / (1,000 - 150) = 64,000 / 850 = $75.29
As you can see, not subtracting the refunded revenue and orders inflates AOV. That, in turn, can affect the decisions a brand might make in the future about ad spend or free shipping thresholds, for example.
The examples above might start to tip you off to some of the common mistakes brands make when they calculate AOV. But there’s good news: These missteps are easy to make, but they’re also easy to fix. Here’s how to double-check your own calculations quickly.
Collecting shipping revenue at checkout inflates your revenue number in your AOV calculation, but it doesn’t reflect actual product value. Your AOV should only measure what customers spend on merchandise, not logistics fees.
This is usually a line item in your platform reports, and it typically excludes shipping. Use this number instead of total collected revenue.
Tax collected isn’t revenue; it goes to the government and has no bearing on order value. Again, your AOV should focus solely on merchandising and marketing.
Make sure the figures for "net sales" or "product revenue" in your platform exclude tax before using these in your AOV formula.
If your revenue number includes unprocessed refunds, you’re overstating what customers actually kept and paid for. That can lead to an inaccurate AOV.
Calculate your AOV using your net revenue, or your gross sales minus any refunds and other costs. Exclude any fully refunded orders from your order count, too. Your AOV is most accurate when you make both of these adjustments together. Keep in mind this may result in a lower or a higher AOV: Sometimes returns remove lower-value orders.
Comparing AOVs calculated from mismatched time periods simply doesn’t work. For example, looking at a seven-day Black Friday/Cyber Monday AOV to 30 days in, say, March, doesn’t really tell you anything useful.
Always label the time period explicitly and compare like-for-like windows, such as the same calendar week year-over-year, the same quarter year-over-year, or 30 days versus the previous 30 days.
There are a lot of ways to get even more detailed analysis out of your AOV. But you’ll miss out on these insights if you’re using a single aggregate AOV across traffic sources, device types, and customer segments. And acting on this blended number can cause you to misallocate your budget.
Before drawing conclusions about specific campaigns or channels, consider segmenting your AOV by traffic source or device type, for example. More on how to do that below!
Here’s the real problem with using a single, blended AOV: It averages data from customers and channels that behave very differently, as you can see in the table below. That means a blended AOV isn’t a great basis for specific decisions about budget allocation, campaign targeting, or product strategy.
How AOV varies by segment — example data
Different acquisition channels attract customers with different purchase intent and price sensitivity, so it can help to understand how your AOV shakes out on different traffic sources.
For example, email traffic typically produces a higher AOV than paid social traffic, because email subscribers already have some brand familiarity.
Say your blended AOV is $50, but email-driven AOV is $74 and paid social AOV is $38. If you blend those two AOV values, you’ll hide that difference and risk misallocating channel budget as a consequence.
Similarly, the devices your customers are using to shop with your business can result in different AOVs. Desktop sessions frequently produce a higher AOV compared to mobile sessions. Multi-item purchases and checkout flows are typically easier to navigate on desktop.
But a big gap in your device-level AOV segments doesn’t mean you should simply accept a lower mobile AOV. Instead, take a hard look at your mobile checkout for opportunities to optimize that experience.
First-time buyers usually have a lower AOV than repeat shoppers because returning customers have more familiarity with your brand and trust in your offerings. Knowing this can help you evaluate the success of your acquisition and retention efforts.
For example, if your new customer AOV is unusually high, your acquisition campaigns are likely attracting high-intent shoppers. If it’s low, your entry-level products may be dominating first purchases. That means it’s time to turn your attention to upselling and cross-selling.
Calculating your AOV for different product categories reveals which lines are driving order value. These insights can help inform decisions about bundling, promotions, and inventory.
Our guide to increasing average order value has all sorts of helpful tips for acting on this kind of category-level AOV data.
In Shopify, you can monitor AOV directly in your Analytics dashboard or through custom reports.
Desktop
Set the date range to the time period you want to calculate AOV for, such as the last 30 days or the last seven days.
Find the Sales Over Time report, which will spell out your net sales (the revenue figure you should use in your own AOV formula) and your total orders for the time frame you picked.
You’ll often see AOV calculated for you in the Sales Over Time report. If not, you can now do the calculation yourself. Remember: Total revenue / total number of orders = AOV!
The blended stats found in your Custom Metrics section offer a comprehensive snapshot of your business's performance, integrating data from orders, refunds, ads, and custom expenses.
Summary Dashboard → /summary — Best for a quick, high-level AOV snapshot alongside other store KPIs. Pin AOV to your Pinned section so you can instantly see it the moment you arrive — just hover over the metric tile and click the 📌 icon.
Affluencer Hub → /affluencer-hub — Great for comparing AOV across influencer campaigns and discount codes. You can also summarize the top five discount codes by AOV for a given quarter to see which promos are driving higher-value orders.
Product Analytics → /product-analytics — Useful for seeing which products drive higher or lower AOV.
Customer Insights → /ltv — Navigate to the LTV section within Customer Insights to see AOV alongside 60-day and 90-day LTV. You can toggle between the last 3, 6, or 12 months to track historical trends and averages over a larger period.
Benchmarks Dashboard → /benchmarks — Filter benchmark data by AOV segment (orders averaging more or less than $100 USD over the last 90 days) to compare your performance against similar stores across platforms like Google, Meta, and TikTok.
Custom Dashboard — Build a fully customized AOV dashboard by adding data visualizations via drag-and-drop metrics, SQL queries, or by asking Moby in plain language and saving the output directly to a dashboard.
Inside, you may see:
Within Triple Whale, Moby is connected to all of your data. You can chat with Moby, Triple Whale's AI assistant, and simply ask something like "What's my AOV for the last 30 days?"
You can take Moby even further with more advanced prompts:
When Moby pulls data from your warehouse, it creates an out-of-the-box visualization automatically — and you can customize the chart type, axes, and formatting before saving it to any dashboard.
AOV is most useful when you consider it alongside other ecommerce metrics. Keep reading for a brief look at why, and check out our guide to all things AOV for a deeper dive.
A higher AOV generally comes with a higher customer lifetime value, or CLV, because both are measures of the value of a customer. That said, this relationship isn’t automatic: Purchase frequency and retention rate also determine lifetime value, for example. (As a refresher, here’s how to calculate CLV.)
Of course, you want to see a strong AOV and a good conversion rate, but these two metrics can move in opposite directions if tactics like aggressive upselling or a high free shipping threshold end up discouraging some shoppers from completing a transaction. Keeping an eye on both measures helps you spot (and then eliminate) friction as soon as possible.
AOV directly affects your ROAS: That’s because higher order value means each ad-driven conversion generates more return.
But you have to keep an eye on costs, too. You can use your AOV to evaluate whether your current ad spend is sustainable. If your AOV doesn’t cover your acquisition and fulfillment costs, then, while you may be building your audience, you’re doing so at a loss.
In order to keep learning (and improving) from your AOV, you’re going to want to check in on it regularly.
How often you recalculate will come down to your goals and your overall reporting cadence, but here are some time frames to consider.
Monthly AOV calculation will give you enough data to smooth out day-to-day fluctuations while still being frequent enough to catch meaningful trends quickly.
Decide on a consistent date each month to run through the AOV formula, such as the first of each month for the previous 30 days. Then, make this a recurring item on your to-do list or calendar. This keeps you accountable to the process and makes sure all your time period comparisons match up.
When you’re running a promotion or paid media campaign or launching a new product, more frequent AOV calculation — like weekly or even daily — can help you isolate how you’re currently performing compared to your baseline.
Make sure you’re comparing this campaign-period AOV to the equivalent non-campaign period from the previous month or year, not to your overall monthly average. That ensures you’re not accidentally capturing or missing any seasonal effects.
Black Friday/Cyber Monday, back-to-school, Valentine’s Day, and other seasonal shopping events can be standouts for certain businesses. If that’s you, then your most meaningful AOV comparison will be to the same period during the previous year, not the previous month. You want to know that your efforts this Black Friday exceeded your efforts last Black Friday, in other words.
Make sure you’re labeling your year-over-year AOV comparisons clearly in all your reporting so other team members and stakeholders know exactly what they’re looking at.
Whether you're monitoring daily performance on the Summary Dashboard, analyzing which products or discount codes drive higher-value orders, Triple Whale gives you multiple ways to track, segment, and act on your AOV data.
Want to see how Triple Whale can help your brand grow AOV and overall profitability? Book a demo today.
Your gross revenue is all the money you made over a set period of time. Your net revenue is that gross revenue minus any costs over that same time period, such as refunds, returns, discounts, shipping, and taxes. You should be using net revenue in the AOV formula.
Always make sure you’re subtracting refunded revenue and refunded orders before calculating your AOV. Otherwise, you may get an incorrect AOV, which can throw off budget and campaign decisions.
Because different traffic sources attract potential customers with different familiarity with your brand, price sensitivity, and purchase intent. Shoppers who come to your site through paid social may not be as likely to convert than those who come through email, for example.
You can use the same formula in your spreadsheet of choice to calculate AOV.
First, find your total revenue and your total number of orders. Enter total revenue in column A, cell 1. Enter total orders in column B, cell 1.
In column C, enter the formula “=A1/B1” and hit “Enter”. Column C, cell 1 will now display your AOV.
.webp)

Body Copy: The following benchmarks compare advertising metrics from April 1-17 to the previous period. Considering President Trump first unveiled his tariffs on April 2, the timing corresponds with potential changes in advertising behavior among ecommerce brands (though it isn’t necessarily correlated).


.webp)

.webp)


.png)


.png)
.png)