Moby Agents help you identify winning patterns, fix under performers, and generate scroll-stopping creative — automatically.
Reduce time spent analyzing creative performance by over 70%


Incremental revenue generated in less than a year with Sonar Send
"Within a year of setting up Sonar Send, it generated $420k in incremental revenue for us. At roughly 40% margins, that's $168,000 of profit generated by Sonar. The value of Sonar alone makes the ROI of Triple Whale significant. It pays for itself many times over."

in fraudulent affiliate commissions detected and prevented by Moby Agents
"We've been able to cut back on how many ads we need to build every day and become more critical about analyzing performance. Triple Whale and Moby Agents have made us more strategic about where—and how—we focus our efforts."

open roles filled by Moby Agents
"We were about to start hiring a few analysts. Then I spoke with AJ and we started testing Moby Agents. I said, 'There's no way we need to hire these people.' It's mind-blowing, really."

reduction in reporting time
.svg)
"What sets this agent apart from generic AI tools is that there’s no need for exporting reports of any kind, Triple Whale houses all the data for you, the prompts are already set, and all you have to do is press a button. It ties revenue growth and marketing efficiency to specific products, all in one agent."
reduction in reporting time
"Moby Agents have unlocked growth beyond what you can even imagine. Yes, we're going to save time and money.
But what’s crazy is that all these operational benefits are giving an edge to the brands in our portfolio—as our operating speed just 10x’d."

Meta ROAS increase

"It’s the only platform that gives us a unified view, on and offline, helping us make smarter decisions about where to invest our marketing dollars."
.webp)
net profit increase YoY

"Triple Whale puts trust and confidence back into where you’re spending your money and how it's coming back to you."

30X
faster weekly analysis

"Moby Agents help me identify both underperforming and overperforming ads from the roughly 600 variations we run simultaneously. Agents have been a significant breakthrough that has greatly improved our operational efficiency."


Austin Urlocker
Marketing Strategist, Dixxon Flannel Company
Jacob Sewak
Growth Strategist, Whitelabeled
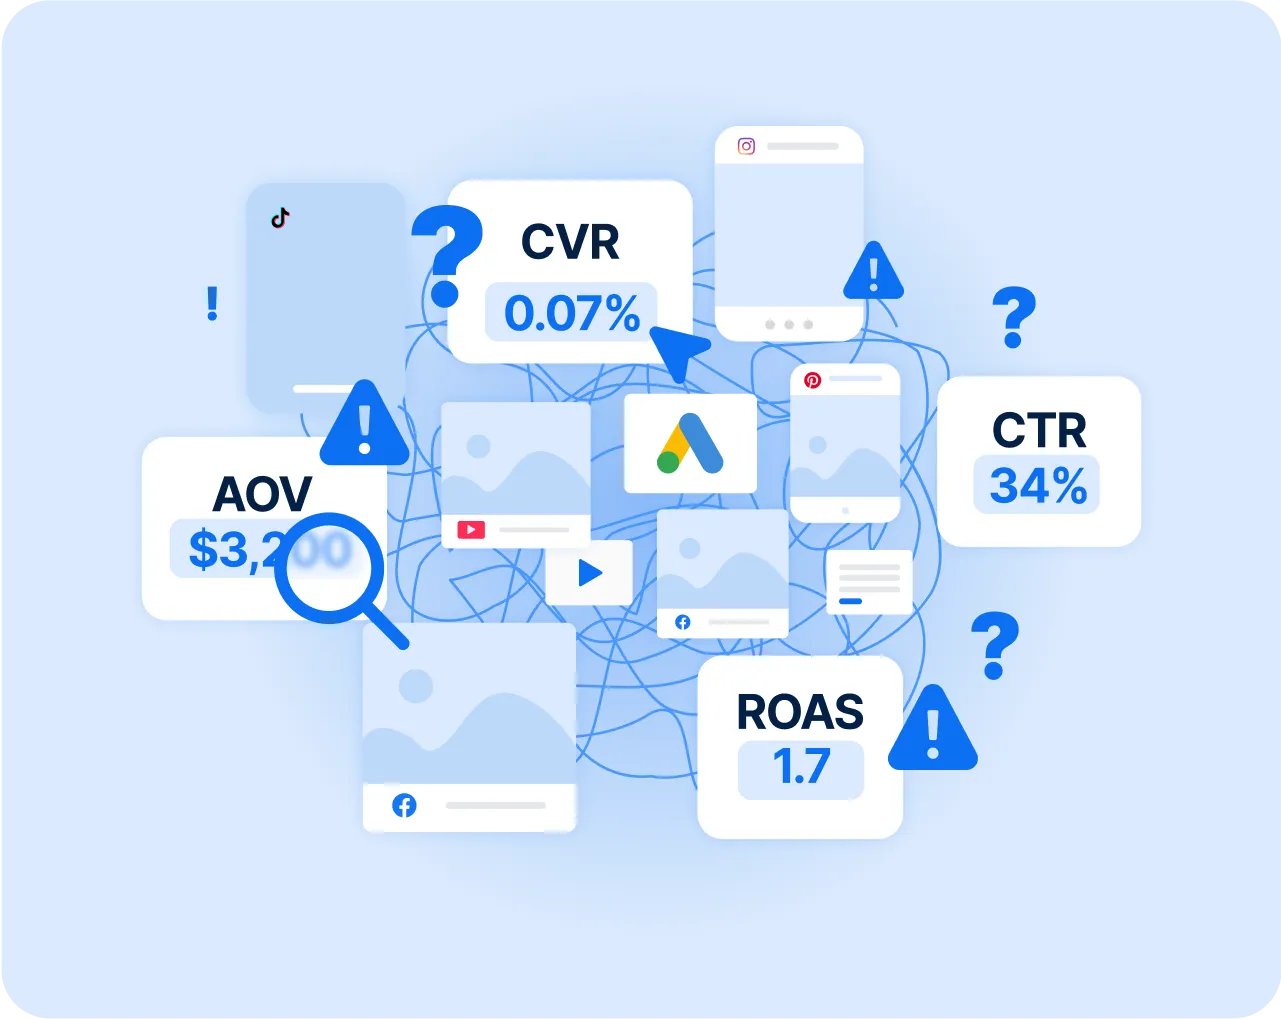
Platforms like Meta and Google demand relentless creative production. But understanding which elements actually drive performance requires analyzing hundreds of ad variations across multiple dimensions — copy, imagery, layout, color palette, emotional tone, and more.
This complex analysis is humanly impossible to perform consistently and at scale, leaving teams guessing which creative strategies to invest in.
Creative Fatigue Diagnosis Agent
Detects creative fatigue early by monitoring declining performance patterns before ROAS drops
Iterate on Top Static Ads Agent
Analyzes your best-performing static ads, identifies winning patterns, and creates new creative to run
Meta Video Ads Strategy Agent
Uses AI vision to watch each video ad and break down individual creative components that drive conversions
Moby Chat is your on-demand analyst and strategist — with superpowers. Try asking things like:
Hear real Triple Whale customers discuss the
mind-blowing possibilities of Moby Agents.


.webp)

.webp)
