Blog
The End of the Dashboard Era? How AI Cuts Through the Noise

The End of the Dashboard Era? How AI Cuts Through the Noise

By 
Last Updated:  
September 3, 2026

For years, dashboards have been how ecommerce teams start the day. Open the dashboard. Check the numbers. Try to work out what happened.

If revenue fell or CAC rose, the chart showed the change. But it didn’t tell you why. So you opened Shopify, Meta, Google, email, and inventory to find the cause.

That model made sense when analytics was built to report on the business. AI is changing the job. Instead of leaving the operator with a chart and a list of follow-up questions, it can investigate the change, connect signals across the business, and help decide what to do next.

That’s what the end of the dashboard era really means. Dashboards aren’t disappearing. They’re becoming part of a larger decision system.

This post looks at what dashboards still do best, where AI is most useful, what the next generation of ecommerce analytics will look like, and which setup fits your business.

Key Takeaways
  • Dashboards still matter for repeat questions. They’re useful for pacing, shared KPIs, and a quick view of business health.
  • Not every insight needs a dashboard visit. Scheduled briefs and alerts can arrive by email.
  • AI is built for the questions that follow. It can help explain why a metric moved and where to look next.
  • Context matters more than a clever answer. AI needs trusted definitions for revenue, customers, margin, and attribution.

Why dashboards are no longer enough

Dashboards are good at answering questions you already know to ask, like whether revenue is on track. But ecommerce rarely follows a straight line. One answer usually creates the next question.

Dashboards were built for known questions

Every dashboard starts with choices someone made in advance. Which metrics should it show? How should the data be grouped? Which filters will people need?

If you ask the same questions every week, that works well. Are we on plan? Which channel is above target? Did revenue rise or fall? But a chart can only take you so far.

Say blended ROAS falls. Your next question might be about new-customer mix. Or creative fatigue, discounts, and profit margins.

That means the investigation has moved beyond the question the dashboard was built to answer.

Why ecommerce questions span the entire business

Dashboards play an important role in ecommerce. They bring revenue, spend, conversion, margin, and other core metrics into one view. Your team can spot a change fast and agree that it needs attention.

The reason behind that change may live somewhere else entirely.

Paid media

Say blended CAC jumps or new-customer ROAS falls. The dashboard shows the change. Now you need to know whether the problem sits inside one channel, campaign, audience, placement, or creative angle.

Did spend move toward a weaker campaign? Did conversion fall? Is creative fatigue setting in? What looks like a broad media problem may be one tired ad, more expensive traffic, or a platform taking credit for demand created elsewhere.

Merchandising and inventory

A hero product is selling fast. But because stock is running low, the product may carry a weaker margin, or customers buying it may be less likely to return.

Now the team needs to connect sales pace with inventory, product costs, discounting, and customer behavior. The right move may be to sell more. It may also mean protecting stock, adjusting the offer, or moving demand to another product.

Lifecycle and customer quality

A promotion can look like a win on day one. Orders are up, CAC looks good, and the dashboard is green. But what happens if those customers never come back?

That’s when you need repeat purchase rate, time to second order, lifetime value, and the products or channels that brought in the strongest customers. A good acquisition day and good customer growth aren’t always the same thing.

Site conversion

If conversion rate drops, the first chart may make it look like a storewide problem. The real issue may be a mobile page, a slow product page, a weak match between the ad and landing page, or friction during checkout.

So the team keeps going. Which device? Which traffic source? Which page, product, or customer segment? The overall rate tells you something broke, but you have to figure out where.

Finance and profitability

And then there’s profit. Revenue may look healthy, but discounts, shipping, product costs, returns, or higher ad spend can pull down contribution margin.

To know whether growth is actually working, you have to connect marketing performance with product mix and real costs. The better question is: did the extra revenue create more profit?

This is what makes ecommerce analysis difficult. Marketing, merchandising, inventory, lifecycle, site performance, and finance all affect one another.

The dashboard is often the right place to spot the signal. The investigation may need to span the whole business.

The interpretation bottleneck

Spotting the problem or issue is fast. But explaining it means choosing the next question to ask, finding the right data, reconciling definitions, and working out who needs to respond.

The data exists. The answer still takes too long. And by the time the team gets there and gets answers, the business may have already moved again.

The rise of AI-native analytics

AI turns analytics into an ongoing investigation. Instead of waiting for another report, you can follow the question wherever the data leads.

From monitoring to investigation

With AI-native analytics, you don’t have to know which report to open. You can start with the problem: “Why did revenue fall yesterday?”

The answer may point to a drop in conversion. So you can ask which devices or landing pages caused it. That may point to paid social traffic. Then you ask which campaigns sent the affected sessions.

Each answer shapes the next question. The change with AI-native analytics is that the investigation stays connected as each answer changes the next question.
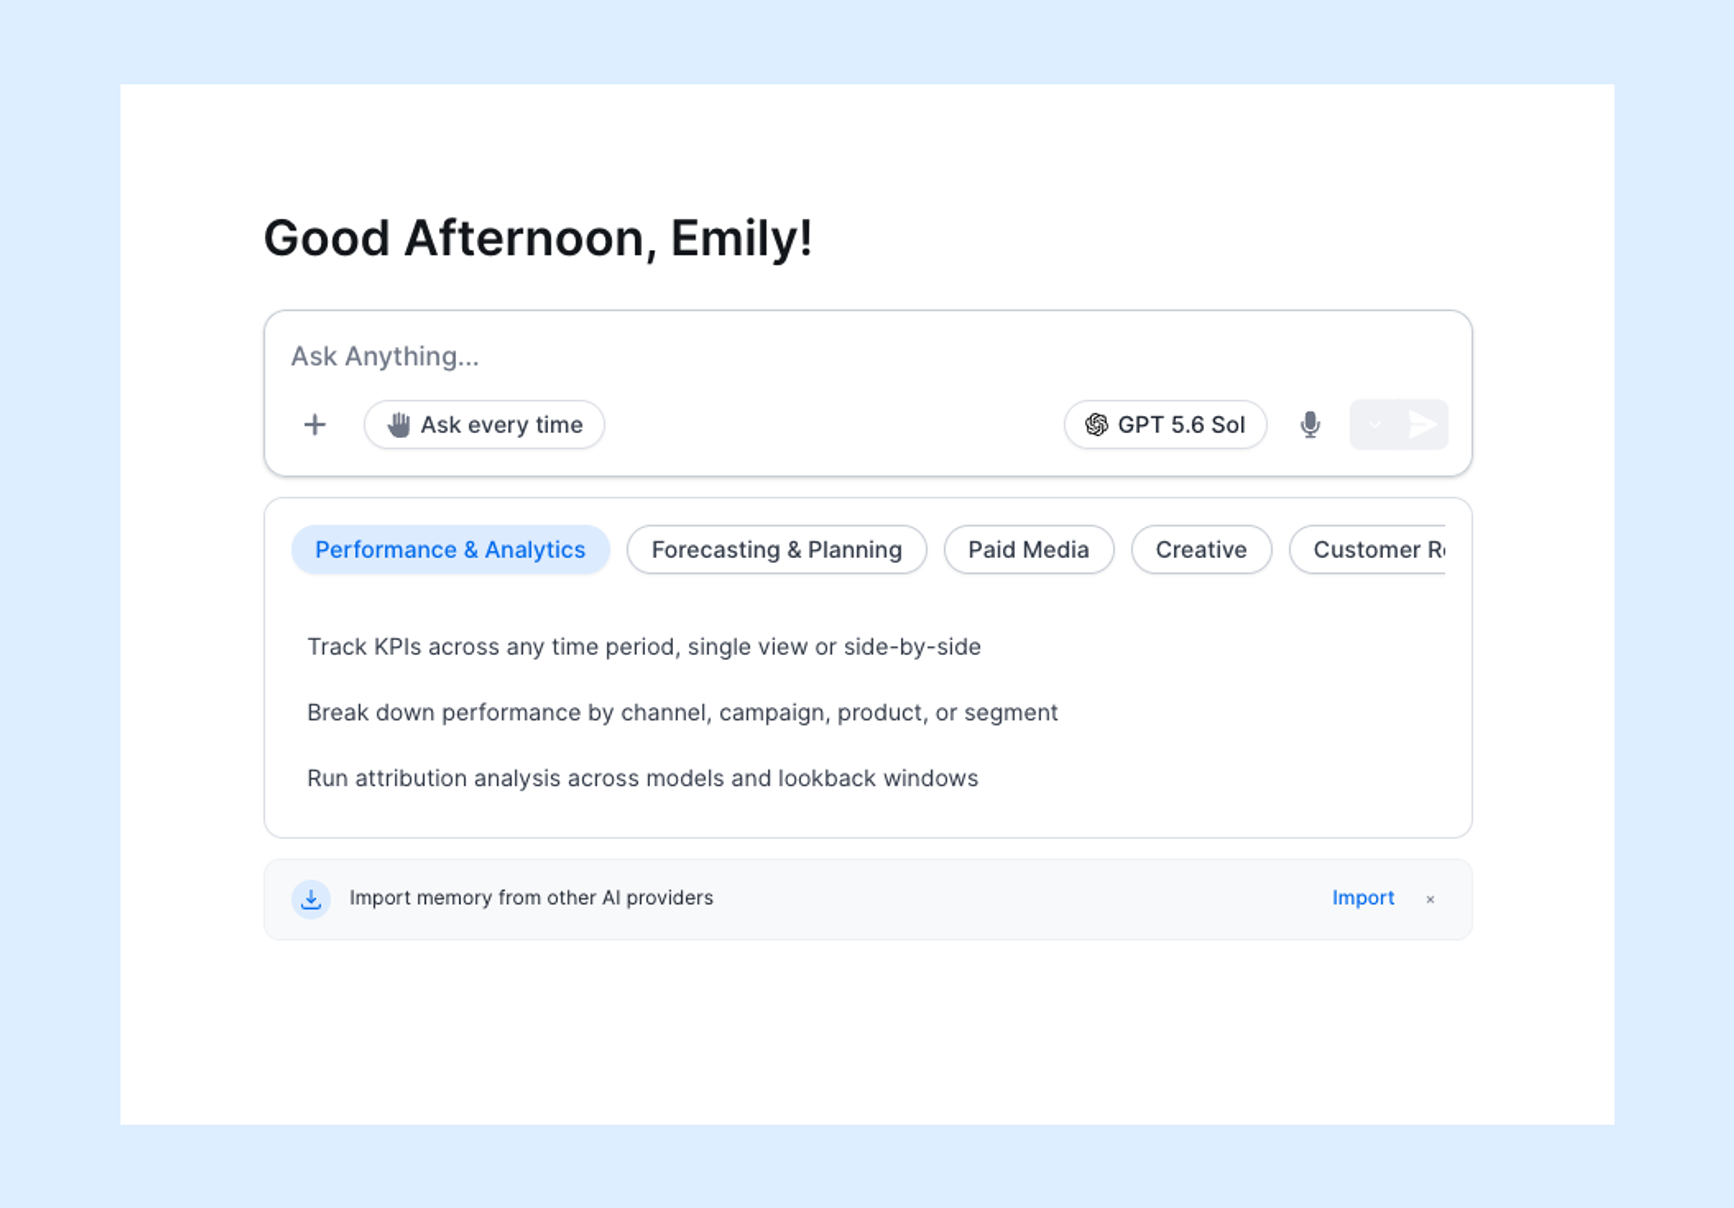
Image showing Triple Whale's Moby chat screen

That’s where Triple Whale’s Moby comes in. Ask why a metric moved, and Moby can use the connected context of your ecommerce business to investigate the change across channels, products, customers, and other available data.

You can narrow the question, test another explanation, or turn the answer into a report without rebuilding the analysis from scratch.

Make smarter decisions faster with Moby.
Book a Demo

From reports to decisions

A report is rarely the end goal. You need to decide what to do about it.

Should the team move budget? Fix a landing page? Restock a product? Change a promotion? Watch the issue for another day?

Those choices often happen outside the dashboard. AI brings the analysis closer to the decision. It can explain the change, compare possible causes, and suggest a next step. 

With Moby, that might start with a prompt like: “Review my performance from the last seven days. Tell me what changed, why it changed, and what you’d do next.” Moby can use the connected context of your ecommerce business to investigate the pattern, explain its rationale, and recommend a supported next step.
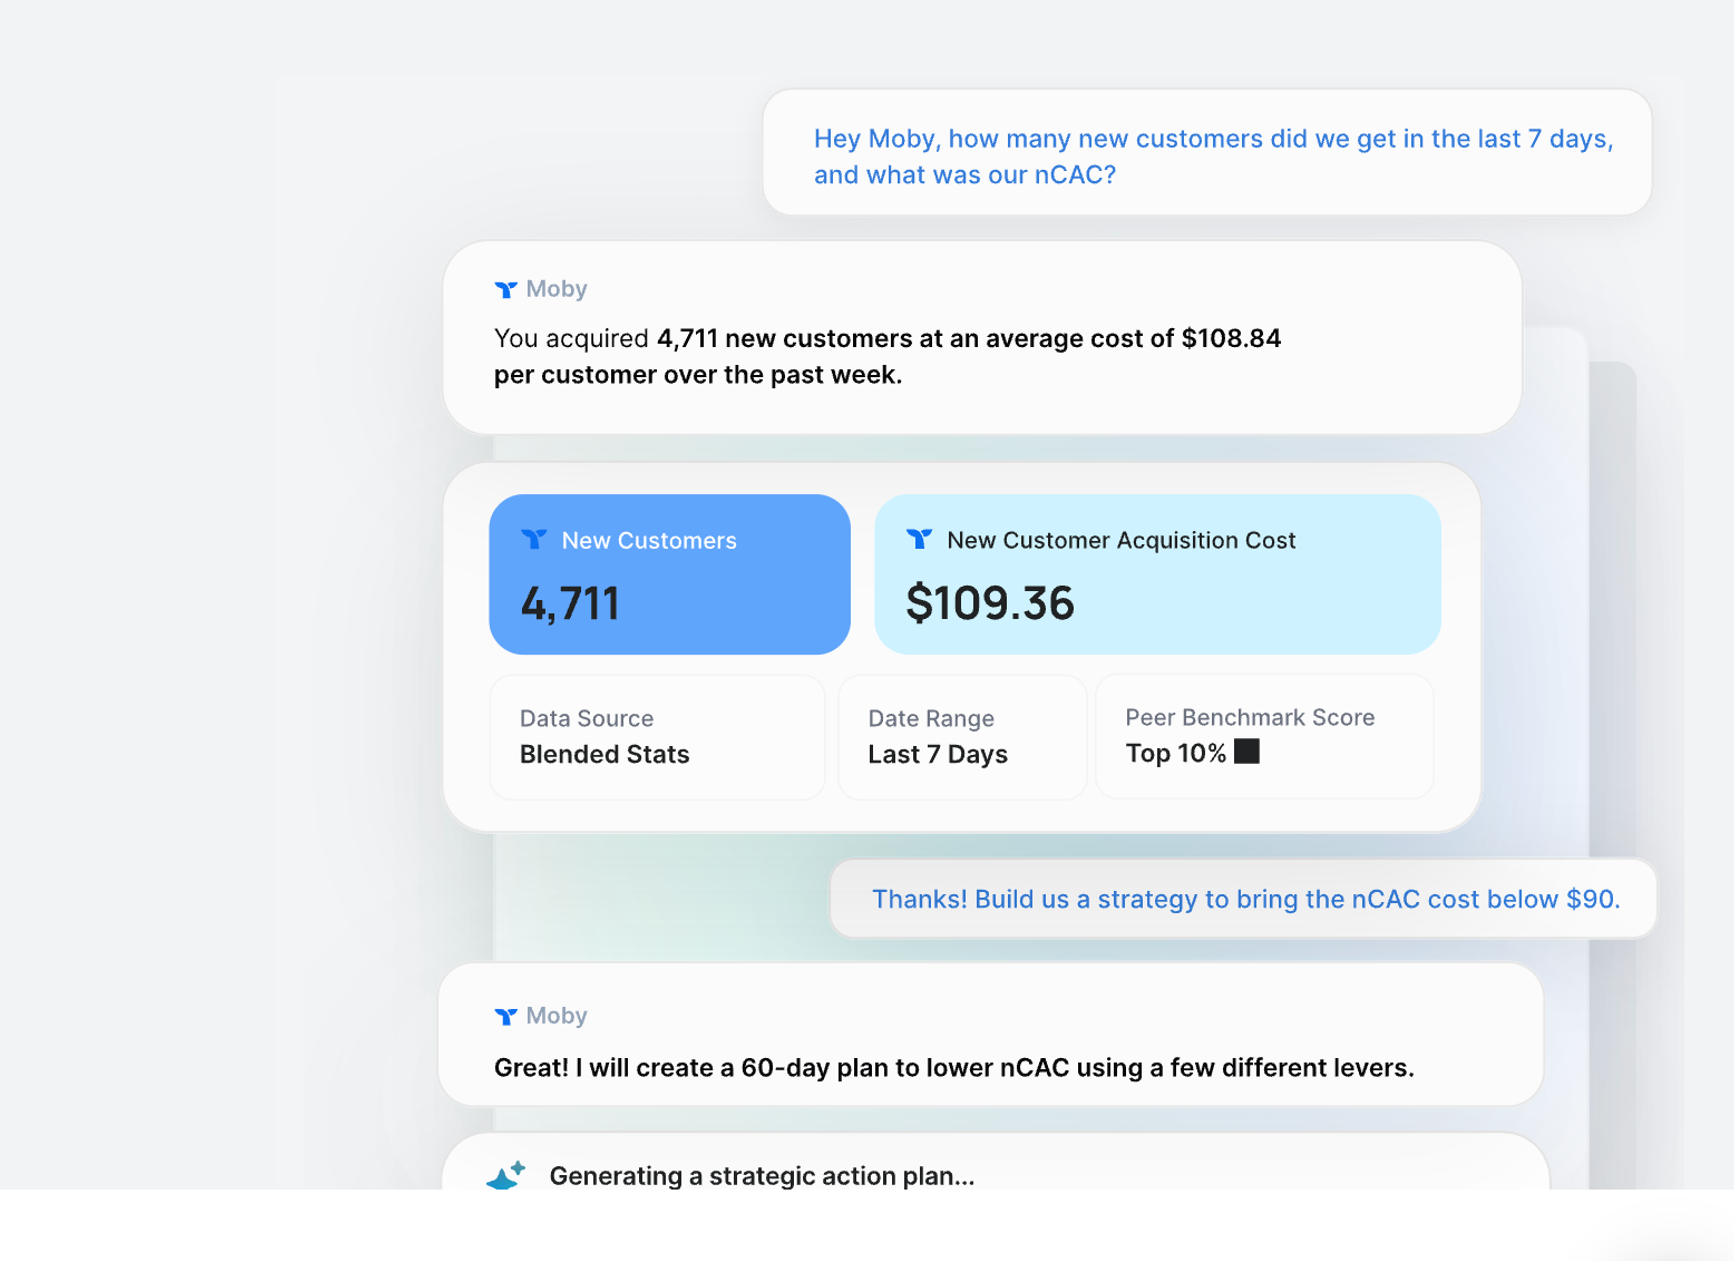
Image showing a chat with Triple Whale's Moby

Where supported, Moby can also prepare an Action for review. That closes some of the gap between finding the answer and carrying the decision into the tools where the work happens, while keeping the operator in control.

This matters in ecommerce because the business moves quickly. Media spend changes by the hour. A viral post can shift demand overnight. A product can sell out before the next weekly report.

The hidden engine behind AI analytics

An AI system can’t reason about your business until it understands what your numbers mean and how the pieces fit together.

Why generic AI produces generic answers

AI can sound confident while missing important context. That’s what makes this part easy to overlook.

Take revenue. Does it include tax? Shipping? Returns? Amazon sales? Subscriptions? 

Those details change the answer. A generic AI model won’t know your rules unless you provide them. That means the model itself is only part of the system. The harder work is giving it trusted data, clear definitions, and the right relationships between customers, orders, products, and campaigns.

See how Moby stands out compared to generic AI platforms here.

The role of the semantic layer

This part gets a little technical, but it’s worth knowing because it explains why one AI answer can be useful, and another can be completely wrong.

A semantic layer is the shared business logic that tells a system what each metric means, how to calculate it, and how different parts of the business connect.

Triple Whale’s semantic-layer framework includes two separate pieces. A Data Dictionary defines each metric. A Data Ontology maps the links between stores, orders, customers, products, campaigns, ad sets, and ads.

Think of it as the rulebook both systems use. If the dashboard and the AI assistant follow different definitions, the business gets two versions of the truth.

The models will keep changing. The trusted map of the business is what makes them useful.

What the post-dashboard era looks like

There isn’t one right interface for every business. The best fit depends on the question you’re trying to answer.

When a dashboard is enough

For many founders and lean teams, a dashboard may be all they need.

If the main goal is to track revenue, spend, efficiency, and a few other health metrics, a simple recurring view works well. The questions are stable. You want a pulse check, not an investigation every morning.

Triple Whale’s free dashboard fits this case. It gives ecommerce operators and founders a clear place to monitor the business without adding a larger analytics workflow.

Dashboards can also keep larger teams aligned.
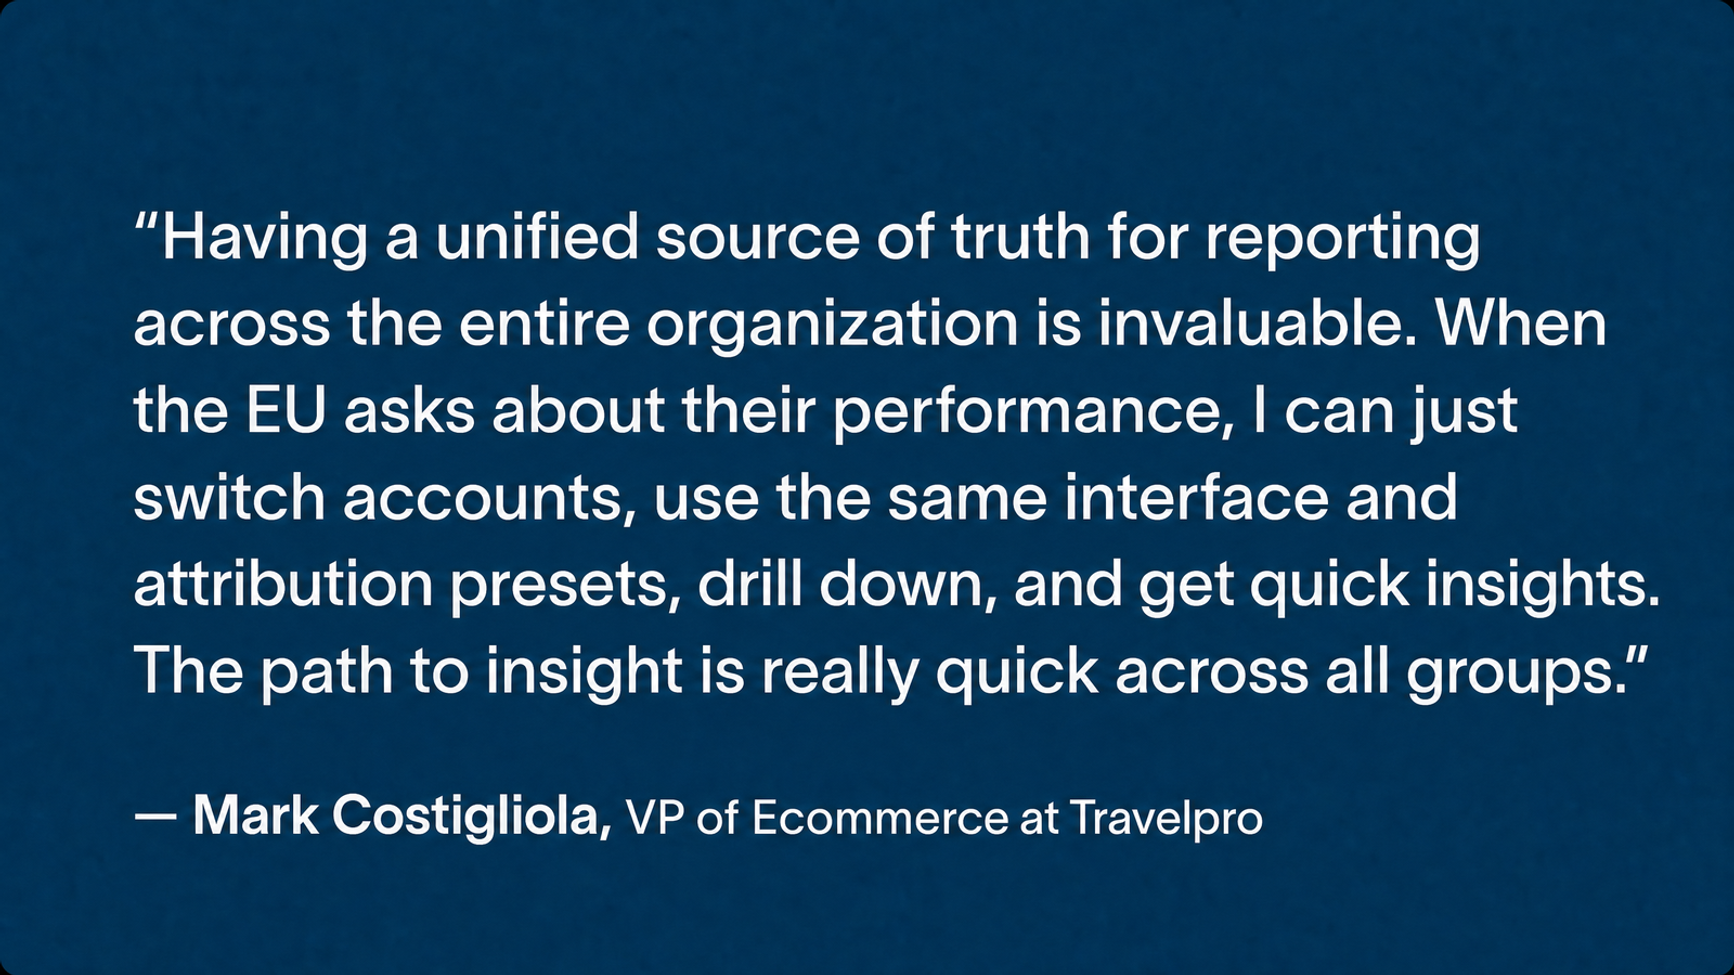
Quote from the VP of Ecommerce at Travelpro on Moby and Triple Whale

When a dashboard needs an investigative layer

A dashboard stops being enough when the same thing keeps happening: a metric changes, and your team has to build a new analysis to explain it.

That’s where dashboard plus AI becomes useful. The dashboard shows what moved. AI helps you ask why, test possible causes, and create the next view as needed.

Automated delivery for routine insights

Some analysis should come to you. A scheduled brief can track pacing, flag anomalies, or highlight changes that need attention.

You don’t have to open a dashboard just to confirm that everything looks normal. You can step in when the system finds an exception worth reviewing.

AI operators for follow-through

And it can go one step further. An AI operator can repeat the analysis, recommend a response, and help carry approved work into connected workflows.

That doesn’t mean handing over the keys. The operator still sets the goal, applies judgment, and controls what the system can do. AI handles more of the repetitive analysis and follow-through.

Here’s what that split looks like in practice:

What the business needs Typical question Best fit Why
A recurring view of business health How are revenue, spend, and efficiency trending? Dashboard The questions are stable, and the key metrics are known.
A shared view for a team Are we on plan, and which KPI needs attention? Dashboard or custom dashboard A shared view keeps everyone aligned around the same numbers.
An explanation for a change Why did revenue fall even though traffic rose? Dashboard plus AI investigation The dashboard finds the signal, and AI follows it across the business.
New questions after every answer Was the decline caused by customer mix, inventory, creative, or margin? Dashboard plus Moby The analysis can't be fully designed in advance.
Scheduled monitoring Tell me when pacing or acquisition efficiency moves outside expectations. Moby insights delivered by email The operator only needs to step in when something deserves attention.
Investigation and follow-through What changed, what should we do, and what work comes next? Triple Whale Data Platform, dashboards, and Moby The business needs monitoring, context, adaptive analysis, and action in one system.

Triple Whale beyond the dashboard

The split is clear: dashboards monitor the business, while AI helps investigate and act on what changed. Triple Whale connects both experiences as part of the same AI operating system, grounded in the same data and measurement foundation.

The Triple Whale Data Platform

The Triple Whale Data Platform is an AI-optimized, fully managed data warehouse for ecommerce. It brings signals from across the business into one place and gives them a shared measurement layer.

That foundation is what connects the rest of the experience. Dashboards, custom reports, and Moby can work from the same business definitions instead of creating separate versions of the truth.

So moving beyond the dashboard doesn’t mean giving it up. It means the dashboard is one way to use the data, rather than the only way.

Moby and dashboards, together

A founder may use a simple dashboard to check the business each morning. A growth team may rely on a custom dashboard for its weekly review. When a question moves beyond that fixed view, Moby can pick it up without losing the context behind the numbers.

That’s the value of having both in one system. The team doesn’t have to export the chart, explain the metric, and start the investigation again in a separate AI tool.
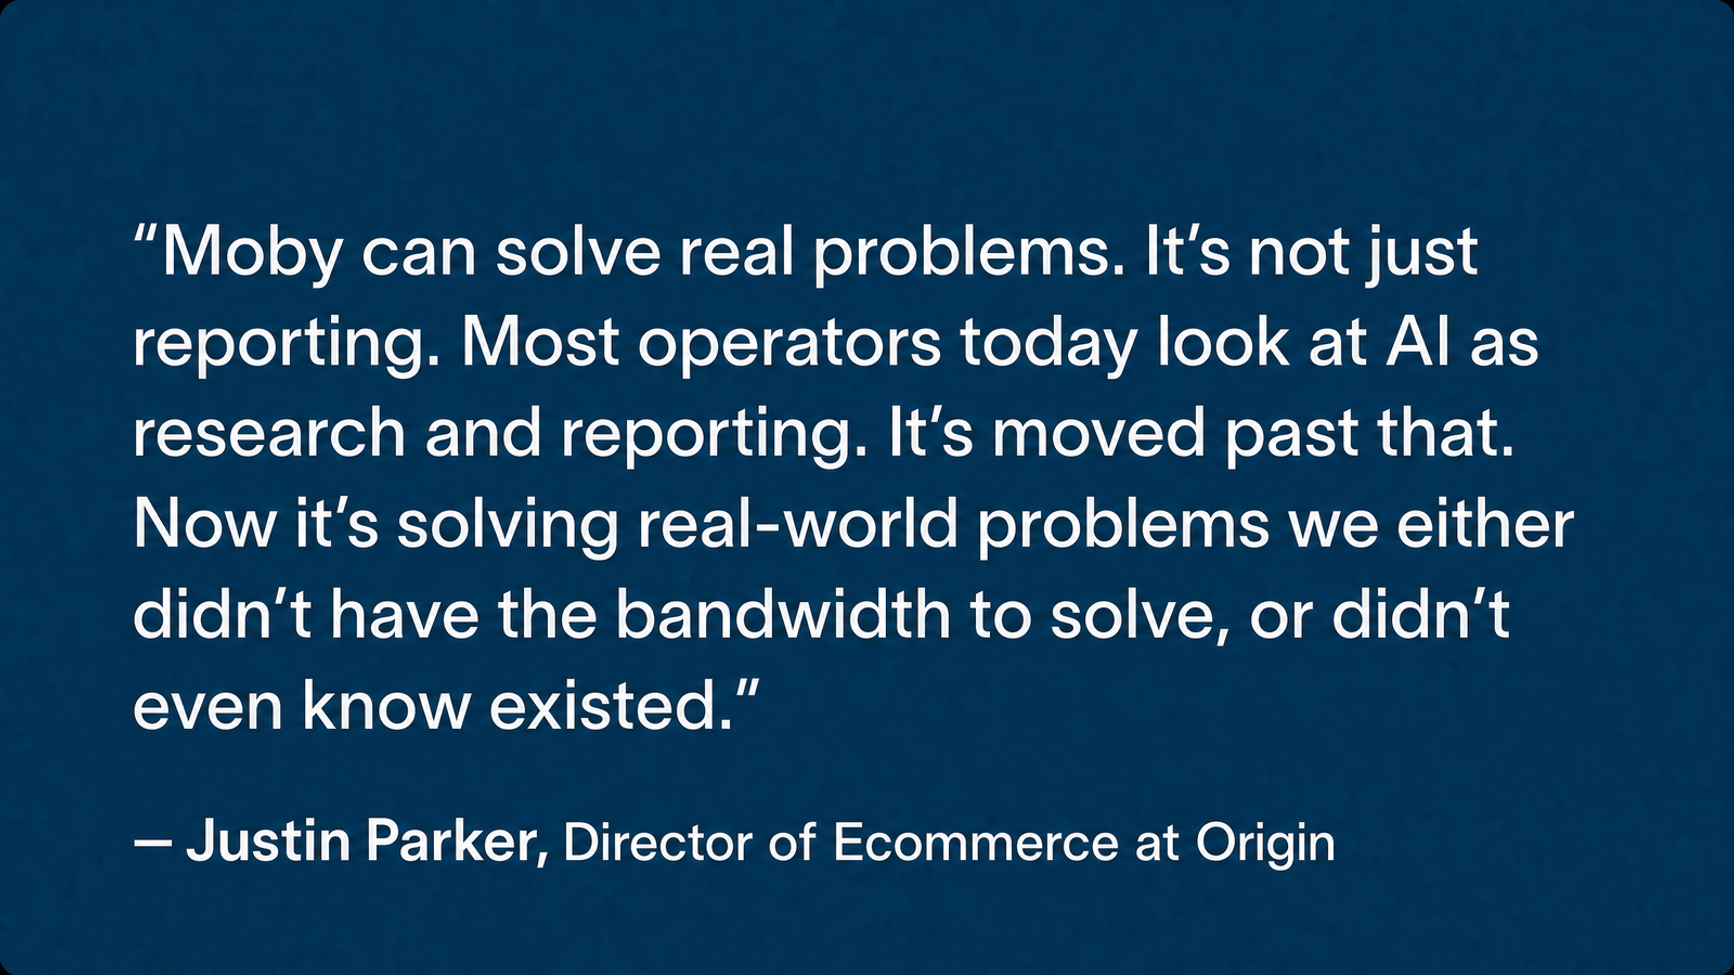
Quote from customer, Origin, on Triple Whale's Moby

Insights without the dashboard visit

The same system can support a different operating rhythm. Moby can run scheduled analysis and send the results to a dashboard or by email.

If you hate dashboards, you’re in luck. The insight can come to you, and you can open Moby when something needs a closer look. Instead of checking every chart just in case, you can focus on the exceptions that need judgment.

The future of operating an ecommerce business

Dashboards will keep teams aligned while AI helps them understand what changed and what to do next. The operator still sets the goals and guardrails. Together, they give ecommerce teams a faster path from a changing metric to a confident decision, all grounded in the same business data. 

Ready to move beyond dashboards? Book a demo and meet Moby, your AI operator for ecommerce.
Make smarter decisions faster with Moby.
Book a Demo
Component Sales
5.32K
Artificial Intelligence

The End of the Dashboard Era? How AI Cuts Through the Noise

Last Updated: 
September 3, 2026

For years, dashboards have been how ecommerce teams start the day. Open the dashboard. Check the numbers. Try to work out what happened.

If revenue fell or CAC rose, the chart showed the change. But it didn’t tell you why. So you opened Shopify, Meta, Google, email, and inventory to find the cause.

That model made sense when analytics was built to report on the business. AI is changing the job. Instead of leaving the operator with a chart and a list of follow-up questions, it can investigate the change, connect signals across the business, and help decide what to do next.

That’s what the end of the dashboard era really means. Dashboards aren’t disappearing. They’re becoming part of a larger decision system.

This post looks at what dashboards still do best, where AI is most useful, what the next generation of ecommerce analytics will look like, and which setup fits your business.

Key Takeaways
  • Dashboards still matter for repeat questions. They’re useful for pacing, shared KPIs, and a quick view of business health.
  • Not every insight needs a dashboard visit. Scheduled briefs and alerts can arrive by email.
  • AI is built for the questions that follow. It can help explain why a metric moved and where to look next.
  • Context matters more than a clever answer. AI needs trusted definitions for revenue, customers, margin, and attribution.

Why dashboards are no longer enough

Dashboards are good at answering questions you already know to ask, like whether revenue is on track. But ecommerce rarely follows a straight line. One answer usually creates the next question.

Dashboards were built for known questions

Every dashboard starts with choices someone made in advance. Which metrics should it show? How should the data be grouped? Which filters will people need?

If you ask the same questions every week, that works well. Are we on plan? Which channel is above target? Did revenue rise or fall? But a chart can only take you so far.

Say blended ROAS falls. Your next question might be about new-customer mix. Or creative fatigue, discounts, and profit margins.

That means the investigation has moved beyond the question the dashboard was built to answer.

Why ecommerce questions span the entire business

Dashboards play an important role in ecommerce. They bring revenue, spend, conversion, margin, and other core metrics into one view. Your team can spot a change fast and agree that it needs attention.

The reason behind that change may live somewhere else entirely.

Paid media

Say blended CAC jumps or new-customer ROAS falls. The dashboard shows the change. Now you need to know whether the problem sits inside one channel, campaign, audience, placement, or creative angle.

Did spend move toward a weaker campaign? Did conversion fall? Is creative fatigue setting in? What looks like a broad media problem may be one tired ad, more expensive traffic, or a platform taking credit for demand created elsewhere.

Merchandising and inventory

A hero product is selling fast. But because stock is running low, the product may carry a weaker margin, or customers buying it may be less likely to return.

Now the team needs to connect sales pace with inventory, product costs, discounting, and customer behavior. The right move may be to sell more. It may also mean protecting stock, adjusting the offer, or moving demand to another product.

Lifecycle and customer quality

A promotion can look like a win on day one. Orders are up, CAC looks good, and the dashboard is green. But what happens if those customers never come back?

That’s when you need repeat purchase rate, time to second order, lifetime value, and the products or channels that brought in the strongest customers. A good acquisition day and good customer growth aren’t always the same thing.

Site conversion

If conversion rate drops, the first chart may make it look like a storewide problem. The real issue may be a mobile page, a slow product page, a weak match between the ad and landing page, or friction during checkout.

So the team keeps going. Which device? Which traffic source? Which page, product, or customer segment? The overall rate tells you something broke, but you have to figure out where.

Finance and profitability

And then there’s profit. Revenue may look healthy, but discounts, shipping, product costs, returns, or higher ad spend can pull down contribution margin.

To know whether growth is actually working, you have to connect marketing performance with product mix and real costs. The better question is: did the extra revenue create more profit?

This is what makes ecommerce analysis difficult. Marketing, merchandising, inventory, lifecycle, site performance, and finance all affect one another.

The dashboard is often the right place to spot the signal. The investigation may need to span the whole business.

The interpretation bottleneck

Spotting the problem or issue is fast. But explaining it means choosing the next question to ask, finding the right data, reconciling definitions, and working out who needs to respond.

The data exists. The answer still takes too long. And by the time the team gets there and gets answers, the business may have already moved again.

The rise of AI-native analytics

AI turns analytics into an ongoing investigation. Instead of waiting for another report, you can follow the question wherever the data leads.

From monitoring to investigation

With AI-native analytics, you don’t have to know which report to open. You can start with the problem: “Why did revenue fall yesterday?”

The answer may point to a drop in conversion. So you can ask which devices or landing pages caused it. That may point to paid social traffic. Then you ask which campaigns sent the affected sessions.

Each answer shapes the next question. The change with AI-native analytics is that the investigation stays connected as each answer changes the next question.

Image showing Triple Whale's Moby chat screen

That’s where Triple Whale’s Moby comes in. Ask why a metric moved, and Moby can use the connected context of your ecommerce business to investigate the change across channels, products, customers, and other available data.

You can narrow the question, test another explanation, or turn the answer into a report without rebuilding the analysis from scratch.

Make smarter decisions faster with Moby.
Book a Demo

From reports to decisions

A report is rarely the end goal. You need to decide what to do about it.

Should the team move budget? Fix a landing page? Restock a product? Change a promotion? Watch the issue for another day?

Those choices often happen outside the dashboard. AI brings the analysis closer to the decision. It can explain the change, compare possible causes, and suggest a next step. 

With Moby, that might start with a prompt like: “Review my performance from the last seven days. Tell me what changed, why it changed, and what you’d do next.” Moby can use the connected context of your ecommerce business to investigate the pattern, explain its rationale, and recommend a supported next step.

Image showing a chat with Triple Whale's Moby

Where supported, Moby can also prepare an Action for review. That closes some of the gap between finding the answer and carrying the decision into the tools where the work happens, while keeping the operator in control.

This matters in ecommerce because the business moves quickly. Media spend changes by the hour. A viral post can shift demand overnight. A product can sell out before the next weekly report.

The hidden engine behind AI analytics

An AI system can’t reason about your business until it understands what your numbers mean and how the pieces fit together.

Why generic AI produces generic answers

AI can sound confident while missing important context. That’s what makes this part easy to overlook.

Take revenue. Does it include tax? Shipping? Returns? Amazon sales? Subscriptions? 

Those details change the answer. A generic AI model won’t know your rules unless you provide them. That means the model itself is only part of the system. The harder work is giving it trusted data, clear definitions, and the right relationships between customers, orders, products, and campaigns.

See how Moby stands out compared to generic AI platforms here.

The role of the semantic layer

This part gets a little technical, but it’s worth knowing because it explains why one AI answer can be useful, and another can be completely wrong.

A semantic layer is the shared business logic that tells a system what each metric means, how to calculate it, and how different parts of the business connect.

Triple Whale’s semantic-layer framework includes two separate pieces. A Data Dictionary defines each metric. A Data Ontology maps the links between stores, orders, customers, products, campaigns, ad sets, and ads.

Think of it as the rulebook both systems use. If the dashboard and the AI assistant follow different definitions, the business gets two versions of the truth.

The models will keep changing. The trusted map of the business is what makes them useful.

What the post-dashboard era looks like

There isn’t one right interface for every business. The best fit depends on the question you’re trying to answer.

When a dashboard is enough

For many founders and lean teams, a dashboard may be all they need.

If the main goal is to track revenue, spend, efficiency, and a few other health metrics, a simple recurring view works well. The questions are stable. You want a pulse check, not an investigation every morning.

Triple Whale’s free dashboard fits this case. It gives ecommerce operators and founders a clear place to monitor the business without adding a larger analytics workflow.

Dashboards can also keep larger teams aligned.

Quote from the VP of Ecommerce at Travelpro on Moby and Triple Whale

When a dashboard needs an investigative layer

A dashboard stops being enough when the same thing keeps happening: a metric changes, and your team has to build a new analysis to explain it.

That’s where dashboard plus AI becomes useful. The dashboard shows what moved. AI helps you ask why, test possible causes, and create the next view as needed.

Automated delivery for routine insights

Some analysis should come to you. A scheduled brief can track pacing, flag anomalies, or highlight changes that need attention.

You don’t have to open a dashboard just to confirm that everything looks normal. You can step in when the system finds an exception worth reviewing.

AI operators for follow-through

And it can go one step further. An AI operator can repeat the analysis, recommend a response, and help carry approved work into connected workflows.

That doesn’t mean handing over the keys. The operator still sets the goal, applies judgment, and controls what the system can do. AI handles more of the repetitive analysis and follow-through.

Here’s what that split looks like in practice:

What the business needs Typical question Best fit Why
A recurring view of business health How are revenue, spend, and efficiency trending? Dashboard The questions are stable, and the key metrics are known.
A shared view for a team Are we on plan, and which KPI needs attention? Dashboard or custom dashboard A shared view keeps everyone aligned around the same numbers.
An explanation for a change Why did revenue fall even though traffic rose? Dashboard plus AI investigation The dashboard finds the signal, and AI follows it across the business.
New questions after every answer Was the decline caused by customer mix, inventory, creative, or margin? Dashboard plus Moby The analysis can't be fully designed in advance.
Scheduled monitoring Tell me when pacing or acquisition efficiency moves outside expectations. Moby insights delivered by email The operator only needs to step in when something deserves attention.
Investigation and follow-through What changed, what should we do, and what work comes next? Triple Whale Data Platform, dashboards, and Moby The business needs monitoring, context, adaptive analysis, and action in one system.

Triple Whale beyond the dashboard

The split is clear: dashboards monitor the business, while AI helps investigate and act on what changed. Triple Whale connects both experiences as part of the same AI operating system, grounded in the same data and measurement foundation.

The Triple Whale Data Platform

The Triple Whale Data Platform is an AI-optimized, fully managed data warehouse for ecommerce. It brings signals from across the business into one place and gives them a shared measurement layer.

That foundation is what connects the rest of the experience. Dashboards, custom reports, and Moby can work from the same business definitions instead of creating separate versions of the truth.

So moving beyond the dashboard doesn’t mean giving it up. It means the dashboard is one way to use the data, rather than the only way.

Moby and dashboards, together

A founder may use a simple dashboard to check the business each morning. A growth team may rely on a custom dashboard for its weekly review. When a question moves beyond that fixed view, Moby can pick it up without losing the context behind the numbers.

That’s the value of having both in one system. The team doesn’t have to export the chart, explain the metric, and start the investigation again in a separate AI tool.

Quote from customer, Origin, on Triple Whale's Moby

Insights without the dashboard visit

The same system can support a different operating rhythm. Moby can run scheduled analysis and send the results to a dashboard or by email.

If you hate dashboards, you’re in luck. The insight can come to you, and you can open Moby when something needs a closer look. Instead of checking every chart just in case, you can focus on the exceptions that need judgment.

The future of operating an ecommerce business

Dashboards will keep teams aligned while AI helps them understand what changed and what to do next. The operator still sets the goals and guardrails. Together, they give ecommerce teams a faster path from a changing metric to a confident decision, all grounded in the same business data. 

Ready to move beyond dashboards? Book a demo and meet Moby, your AI operator for ecommerce.
Make smarter decisions faster with Moby.
Book a Demo

Emily Kordys

Emily is a Content Writer at Triple Whale, where she creates data-driven content for ecommerce marketers. She has spent nearly a decade in content marketing across the B2B SaaS and ecommerce industries, helping brands turn complex topics into engaging, actionable content.

Body Copy: The following benchmarks compare advertising metrics from April 1-17 to the previous period. Considering President Trump first unveiled 
his tariffs on April 2, the timing corresponds with potential changes in advertising behavior among ecommerce brands (though it isn’t necessarily correlated).

Ready to make confident, data-driven decisions faster than ever?

Thank you! Your submission has been received!
Oops! Something went wrong while submitting the form.