


Just by clicking this link, you gave us some data. Every website, every application, and any interaction with an ecommerce brand becomes a data point that a brand can use – if it knows how.
But the amount of data collected doesn’t always correlate with value, and many brands are turning to generative AI and LLMs (large language models) — like ChatGPT and Claude — to turn that data into actionable intelligence. LLMs can help analyze data quickly and adapt to unique business requests, but there are specific guidelines an ecommerce brand should follow in order to obtain the best results possible with the power of generative AI.
In this article, we’ll explore:
Finally, we’ll introduce you to the next generation of ecommerce intelligence with agentic AI, and the Moby Agents that are trained on ecommerce data and ready to uncover powerful insights more quickly, with no data collection, preparation, or prompting required.
A comprehensive breakdown of what agentic AI is and how AI agents can help you grow and scale your ecommerce business is here: The Ultimate AI Agents Playbook for Ecommerce Brands.
Remember how we said most brands are just drowning in data?
We consider LLMs to be a bit of a life raft. An LLM can take the raw data you plug into it and uncover some insights you may not have seen initially (or ever) because you weren’t sure what you were looking at.
There are several applications for LLMs to optimize an ecommerce brand, but to name a few:
While they’re powerful, LLMs can’t access your data directly.
You’ll need to export data from various platforms, prepare it in a way the LLM can understand, and craft a prompt that will provide the response you need. Because these tools don’t have access or real-time connections to your Shopify store, advertising accounts, Google Analytics, and more, they are limited in the insights they can provide.
The quality of the insights depends on the quality and completeness of the data you provide to the LLM.
LLMs also can’t make any business decisions for you, nor can they guarantee the accuracy of the predictions they make. They work best as partners to help you understand your data and to generate hypotheses, but the strategic decisions will remain in your hands.
Unlike ChatGPT and Claude, Triple Whale’s Moby Chat Need to know something about your data? Just ask. Try Moby Chat to get instant business-specific insights from your always-on smart assistant. Moby has direct access to your data, and is basically an ecommerce-trained generative AI tool that already understands the nuances of ecommerce.
The foundation is the Triple Whale Data Platform, which combines all of the ecommerce data you have available to pull all of your metrics into a single source of truth. It is also layered with sophisticated attribution models, forecasting abilities, and the business intelligence tools to analyze your data from every angle.
Moby is the only AI that understands ecommerce, and is able to revolutionize the way you access and analyze your data.
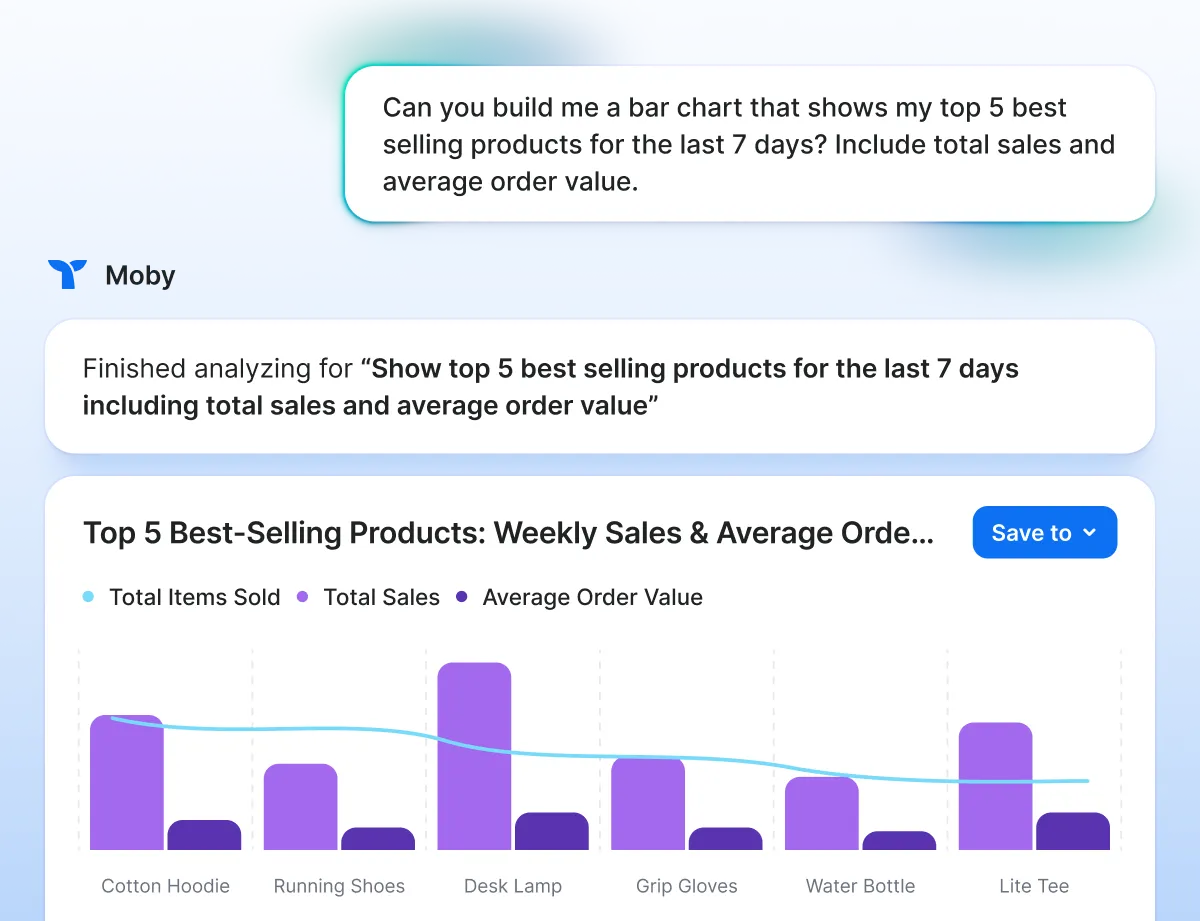
Need to know something about your data? Just ask. Try Moby Chat to get instant business-specific insights from your always-on smart assistant.
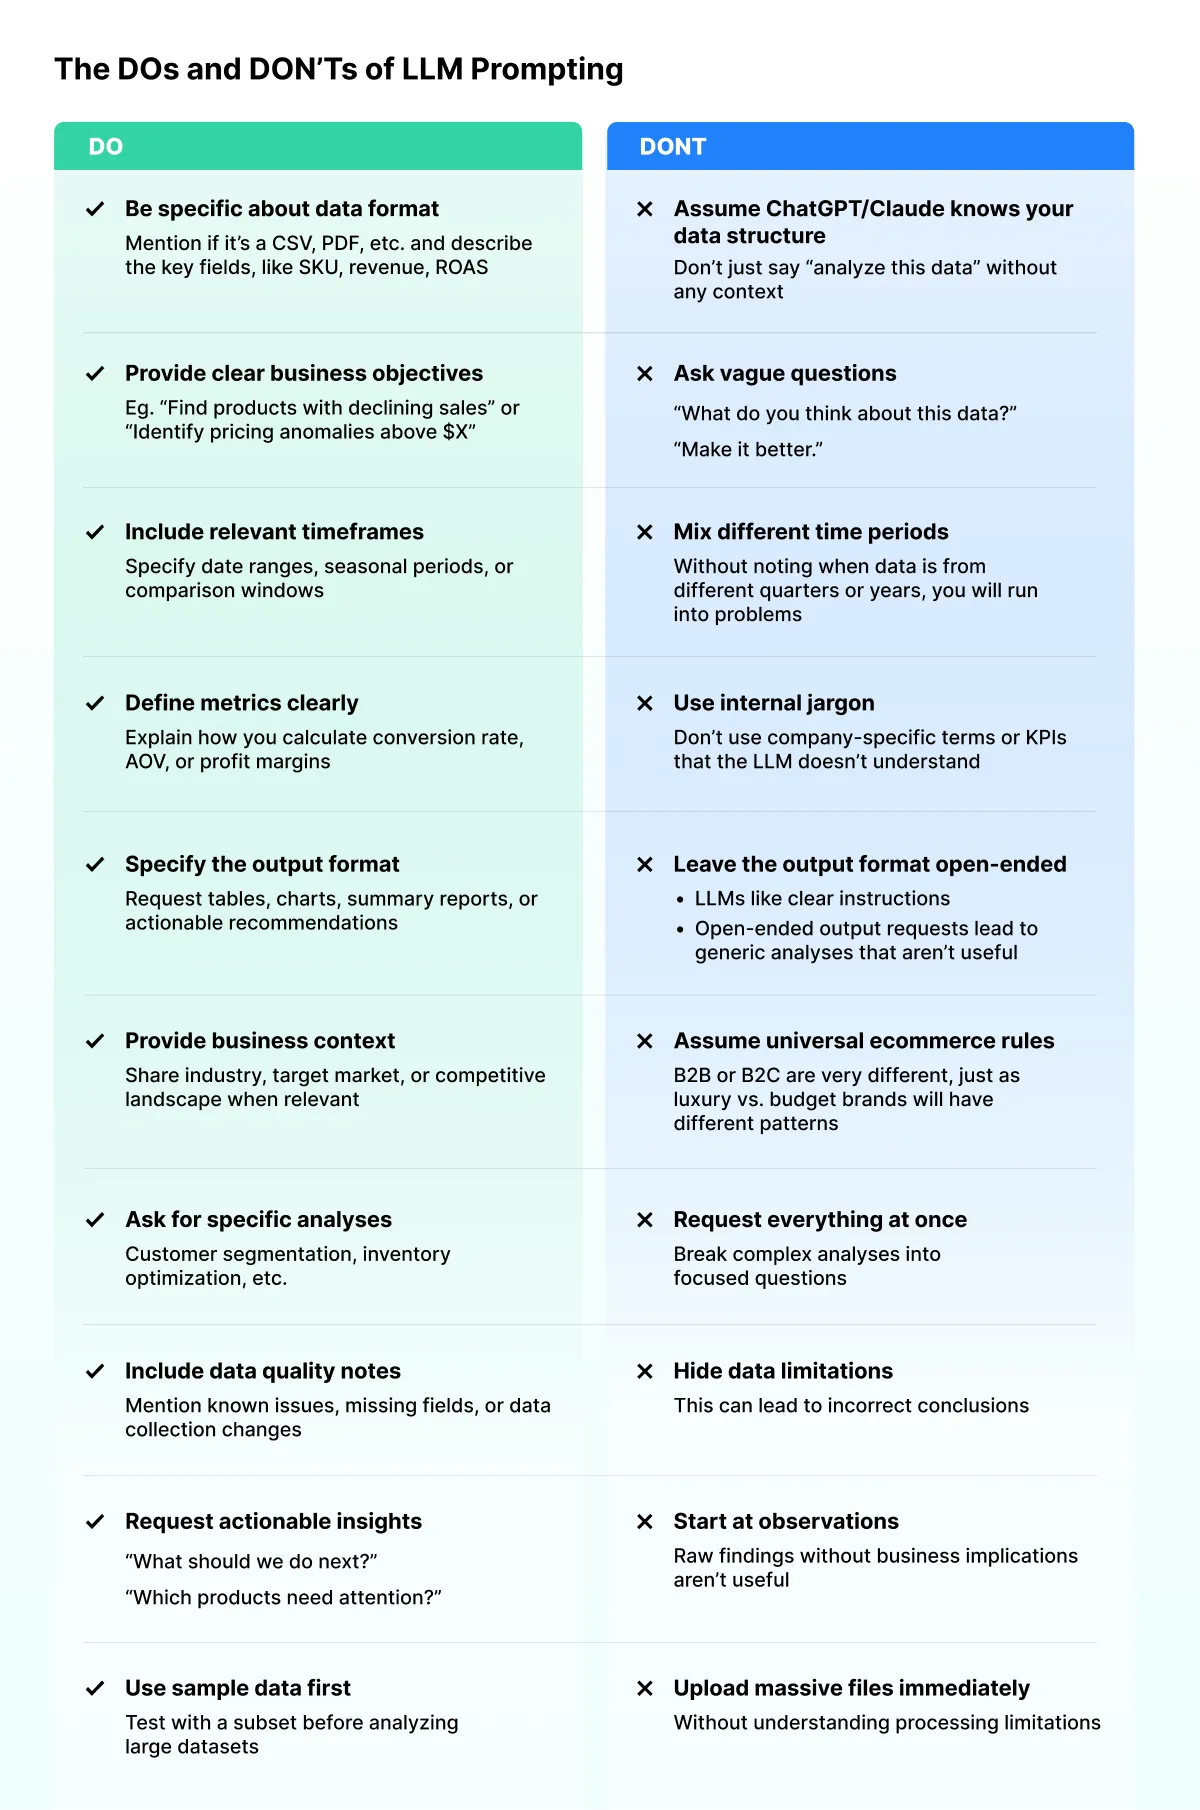
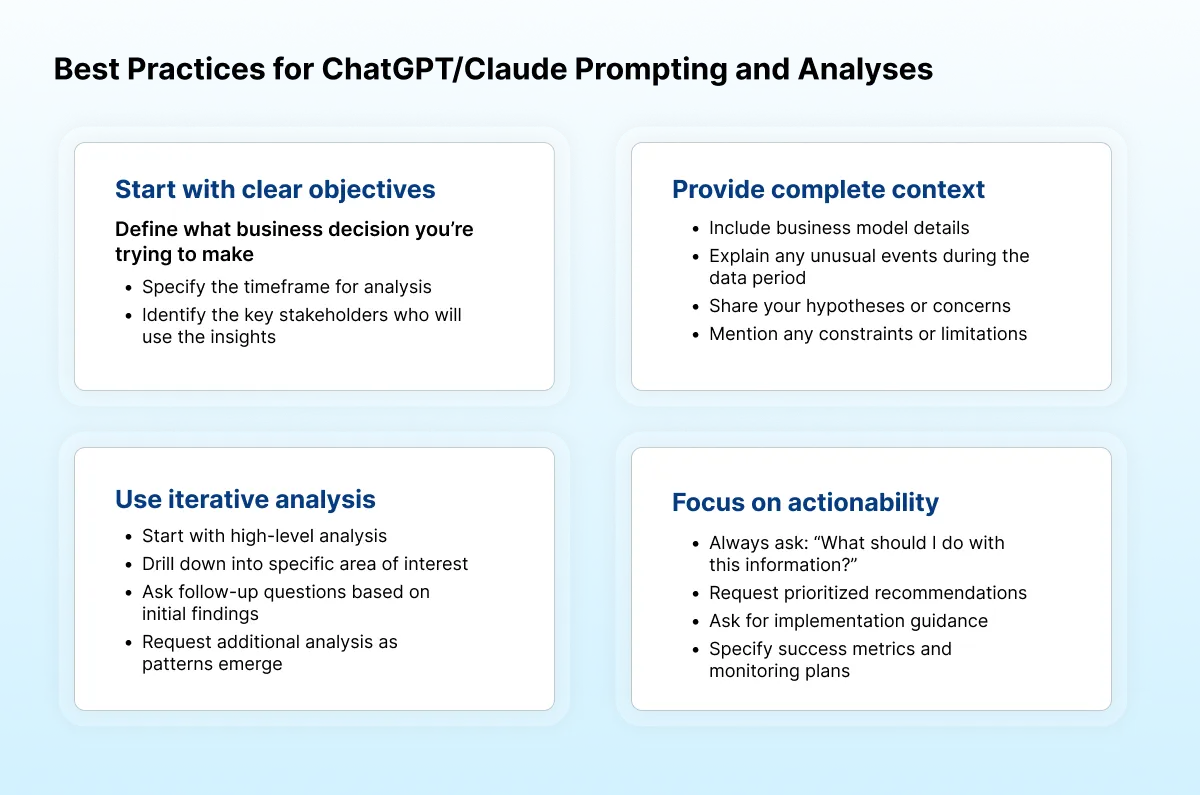
To be successful with LLMs, you need to understand how they process information and structure your requests in a way that most effectively produces your desired end result.
To provide valuable insights, the LLM needs extremely clear directions.
Here are some general guidelines:
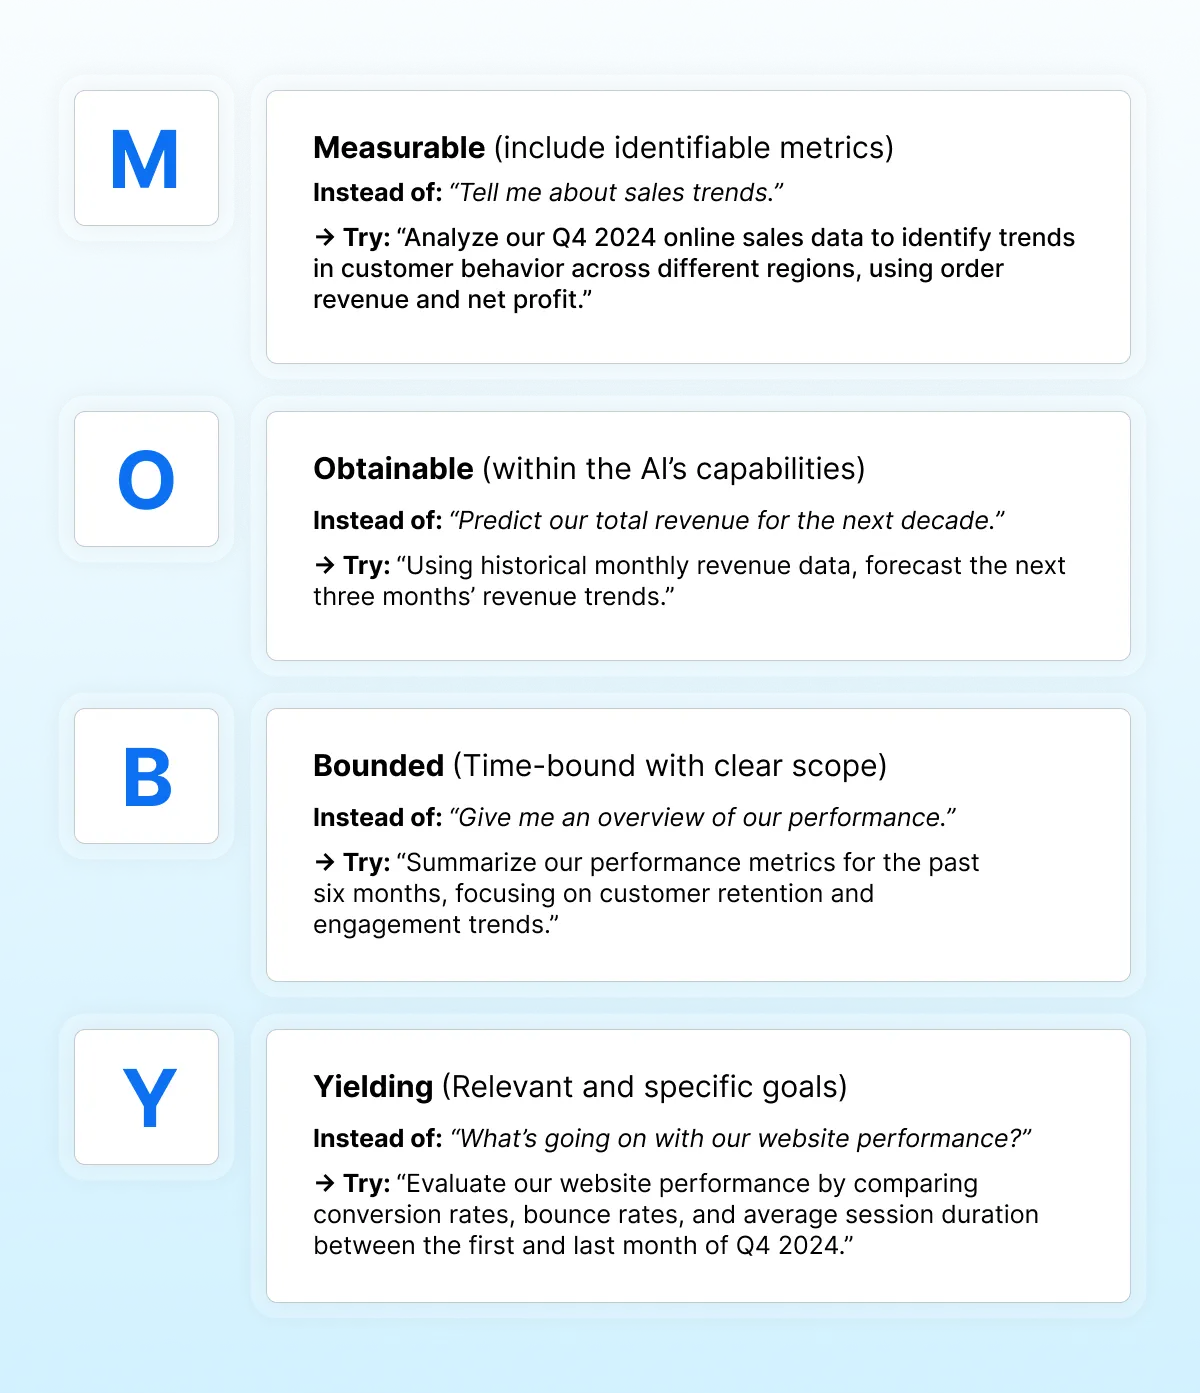
When in doubt about how to formulate a prompt, remember that it should be measurable, obtainable, bounded, and yielding. We like to use the acronym MOBY:
The quality of the analysis an LLM delivers is directly connected to the quality of the data it is provided with.
The data preparation phase is crucial, and it will represent the difference between receiving generic observations and actionable intelligence to move your business forward.
Below are some guidelines for collecting, organizing, and getting data ready for LLM analysis.
1. Start by identifying all key data sources relevant to your business
2. Set up proper data export capabilities to ensure you can access data in usable formats
3. Before diving into analysis, confirm that your tracking infrastructure is correctly set up
1. Standardize your data format by creating consistent naming conventions
2. Group your data into logical, analysis-ready structures
3. Clean and validate data to ensure data quality
1. Build reusable templates for common analysis needs
2. Include contextual information for AI analyses
When using tools like ChatGPT or Claude, always provide relevant context to improve analysis quality:
You could skip the many steps required to download, clean, and organize your data by using AI agents. Learn more in The Ultimate AI Agents Playbook!
As evidenced by many prompts gone wrong or halfway to what you expected, crafting an effective prompt is both an art and a science. The best prompts combine clear business objectives with structured data requests and specific output requirements. If a prompt follows this approach, it is more likely to deliver insights that are actionable immediately, rather than generic observations that will require additional interpretation.
Since ecommerce analysis typically involves multiple variables and competing priorities, the prompting strategy should reflect the complexity of decision-making involved. Simple question-and-answer scenarios aren’t often useful, and effective prompts will provide the generative AI model with enough structure to deliver valuable insights.
Here are some guidelines for how to prompt LLMs:
Instead of: “analyze my data”
Use:
Analyze my Q4 sales data to identify which product categories had the strongest growth, what customer segments drove the most revenue, and where I should focus inventory investment for Q1.The questions you ask an LLM make all the difference. For example:
Always ask for:
The following examples demonstrate how to apply LLM analysis to a few common ecommerce challenges:
Each example will include the business context, data preparation requirements, and some detailed prompts you can adapt for your specific needs. These are templates and not scripts to be followed exactly. As each business has unique characteristics, these should be reflected in how you structure your analysis requests and interpret the results. Adapt, iterate, and refine the prompts to get the exact output you’re hoping to achieve.
A modern ecommerce brand is advertising on multiple platforms with budgets spread across Facebook, Google Ads, TikTok, and more – which can make it very difficult to decipher just how effective any one ad (or any one platform) is for the brand as a whole.
A brand needs to know:
It’s not just about cost-per-click or number of impressions, but instead the brand needs to determine if the ad spend it generating meaningful business outcomes at a sustainable cost. Beyond individual campaign performance, it’s important to understand how different platforms complement each other in the overall marketing funnel.
While one platform may drive high awareness, another might be better for converting customers. Understanding how the overall funnel works will allow a brand to budget funds for platforms based on specific business needs.
A dynamic budget allocation can respond to real performance data rather than gut feelings or outdated assumptions. But, in order to accomplish that, a brand must understand both their current performance and historical trends in order to make decisions about where to decrease or maintain spending.
To get a comprehensive view of advertising performance across platforms, a brand must build a system that compiles all of the essential metrics from each platform in the same place:
Once all of the data is organized, the LLM will be able to transform the raw data into insights that might take hours to identify manually.
Here is a suggested LLM prompt for evaluating ad performance across data platform:
# Ad Performance Data Analysis Request

## Context
I have comprehensive advertising performance data across multiple platforms for both 30-day and 365-day periods. I need actionable insights to optimize ad spend allocation and improve overall performance.

## Your Role
Act as a senior digital marketing analyst with expertise in performance marketing, budget optimization, and cross-platform advertising strategy.

## Analysis Framework
Please conduct a systematic analysis following this structure:

### Performance Efficiency Assessment
- Calculate and rank platforms by ROAS (highest to lowest)
- Identify cost per acquisition leaders and laggards
- Evaluate cost efficiency for impressions and clicks
- Flag platforms with spending inefficiencies

### Customer Acquisition Analysis
- Segment new vs. repeat customer acquisition by platform
- Calculate true cost per new customer by platform
- Assess customer lifetime value by acquisition source

### Budget Optimization Strategy
- Recommend budget reallocation based on performance data
- Identify platforms for increased/decreased investment
- Suggest optimal budget percentage distribution
- Identify spending caps due to diminishing returns

### Trend & Pattern Recognition
- Compare 365-day vs. 30-day performance shifts
- Identify platforms with positive/negative momentum
- Note seasonal patterns affecting performance
- Highlight concerning metric declines

## Required Outputs

### Format Requirements
1. Executive Summary (3-4 key findings + primary budget recommendation)
2. Platform Scorecard (Letter grades A-F with 2-3 bullet justifications each)
3. Budget Allocation Table (Specific percentages/amounts with current vs. recommended)
4. Action Priority Matrix (Top 5 actions ranked by impact/urgency)

### Analysis Standards
- Support all recommendations with specific data points
- Include confidence levels for major recommendations (High/Medium/Low)
- Provide reasoning for each letter grade assignment
- Quantify potential impact where possible (e.g., "could improve ROAS by X%")

## Data Interpretation Guidelines
- Prioritize statistical significance over absolute numbers for smaller platforms
- Consider platform maturity when evaluating performance
- Factor in attribution windows and measurement differences
- Account for seasonal business patterns in trend analysis

Please begin your analysis once I provide the data.
As you can see, this is a very detailed and organized prompt that requires accurately compiled data to produce useful results.
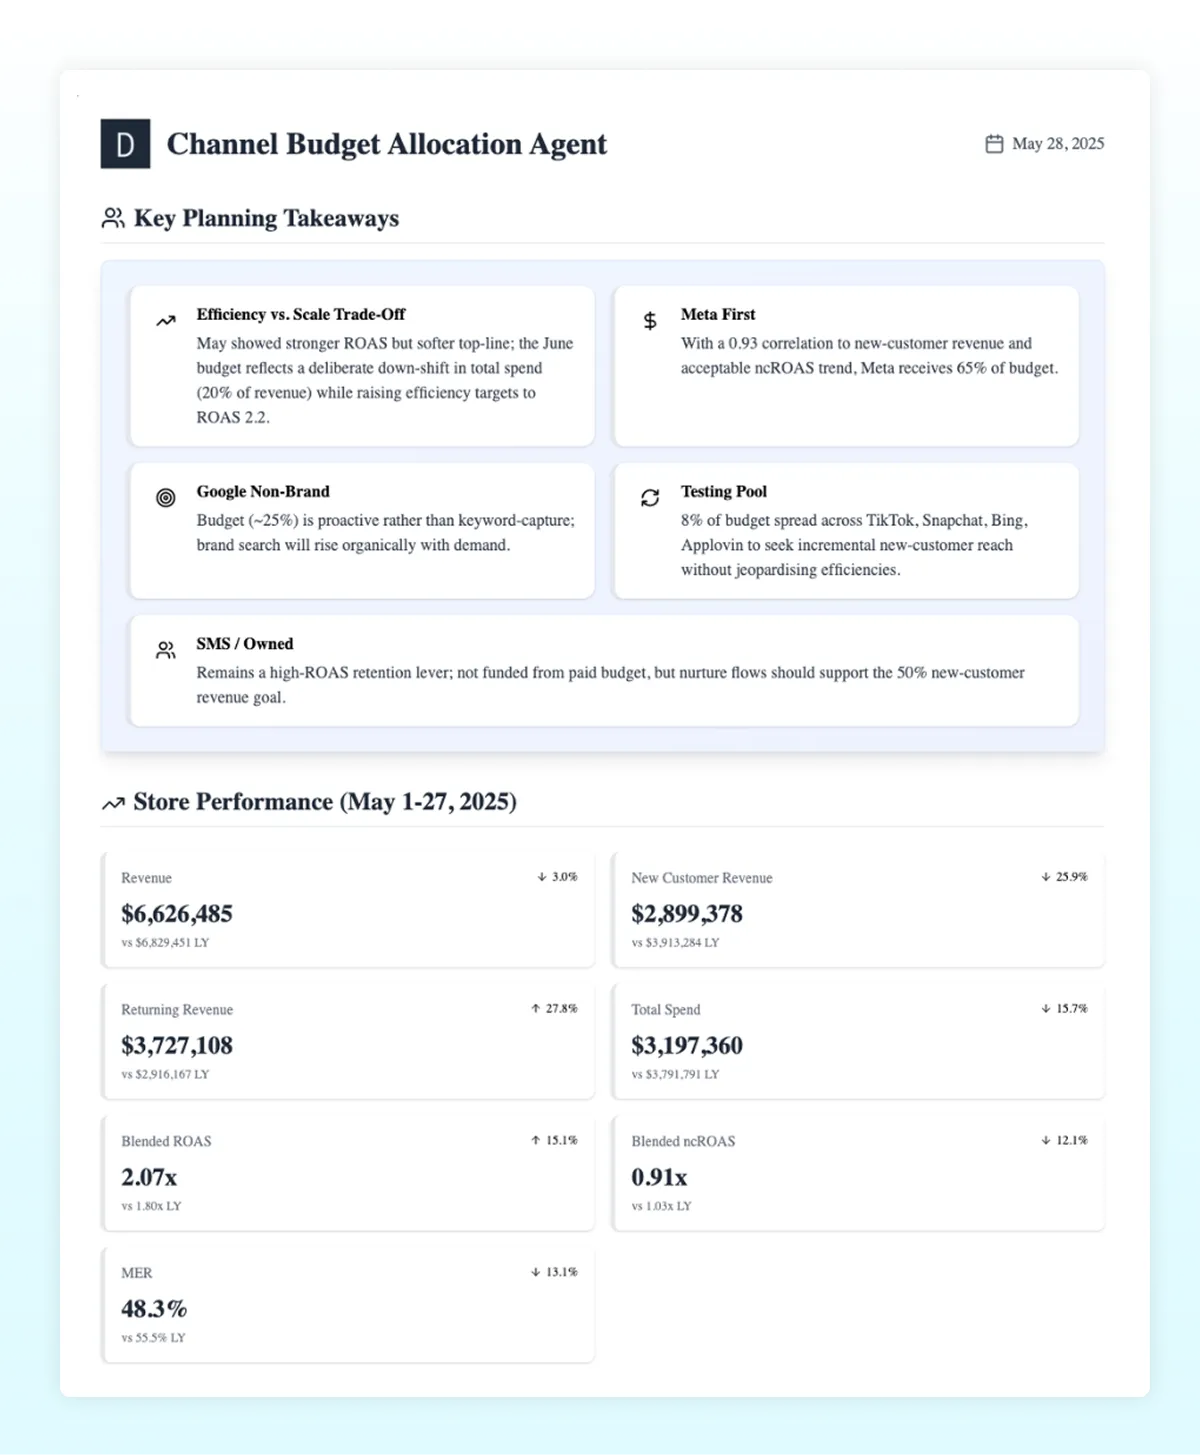
Here's what the output of that exact prompt would look like in Moby Chat, which automatically accesses your brand's data, no uploading required.
With Triple Whale, all of the data is already compiled accurately for this analysis, and there is even an agent available to automatically run analyses to evaluate ad performance across platforms, and it’s called the Channel Budget Allocation Agent.
The Channel Budget Allocation Agent provides real-time, optimal budget distribution across marketing channels. It is able to analyze performance data and spending efficiency over the past 30 and 365 days.
Focusing on metrics like spend, ROAS, and conversion values, the Agent can help a brand maximize returns and adjust recommendations for budget allocation based on current performance as well as historical trends.
How the Channel Budget Allocation Agent works:
Want to skip all of the data collection, organization, and prompt crafting required to do this analysis in an LLM yourself? Give the Channel Budget Allocation Agent a try today.
Proper inventory management is essential for an ecommerce brand, because an overstock of products ties up cash flow and hikes up storage costs, and too little inventory means missed sales and frustrated customers. With thousands of SKUs across multiple categories, each product could even have different demand patterns, seasonality, and profit margins.
A brand needs to know:
Understanding top sellers versus slow movers should also consider profit margins, inventory turnover, and storage costs. A high-revenue product that sits in a warehouse for months might be less valuable than a lower-revenue item that turns over weekly.
Sudden sales spikes could indicate viral social mentions, stockouts from competitors, or the early stages of a trending product category. Being able to identify these patterns early allows you to capitalize on opportunities or prepare for demand shifts ahead of time.
Accurate forecasting is a cornerstone of efficient inventory management. This means understanding not just the historical patterns but how external factors like seasonality, marketing campaigns, and market trends influence demand for each product.
To effectively prepare your inventory data for LLM-powered analysis, start by collecting and organizing the following key categories:
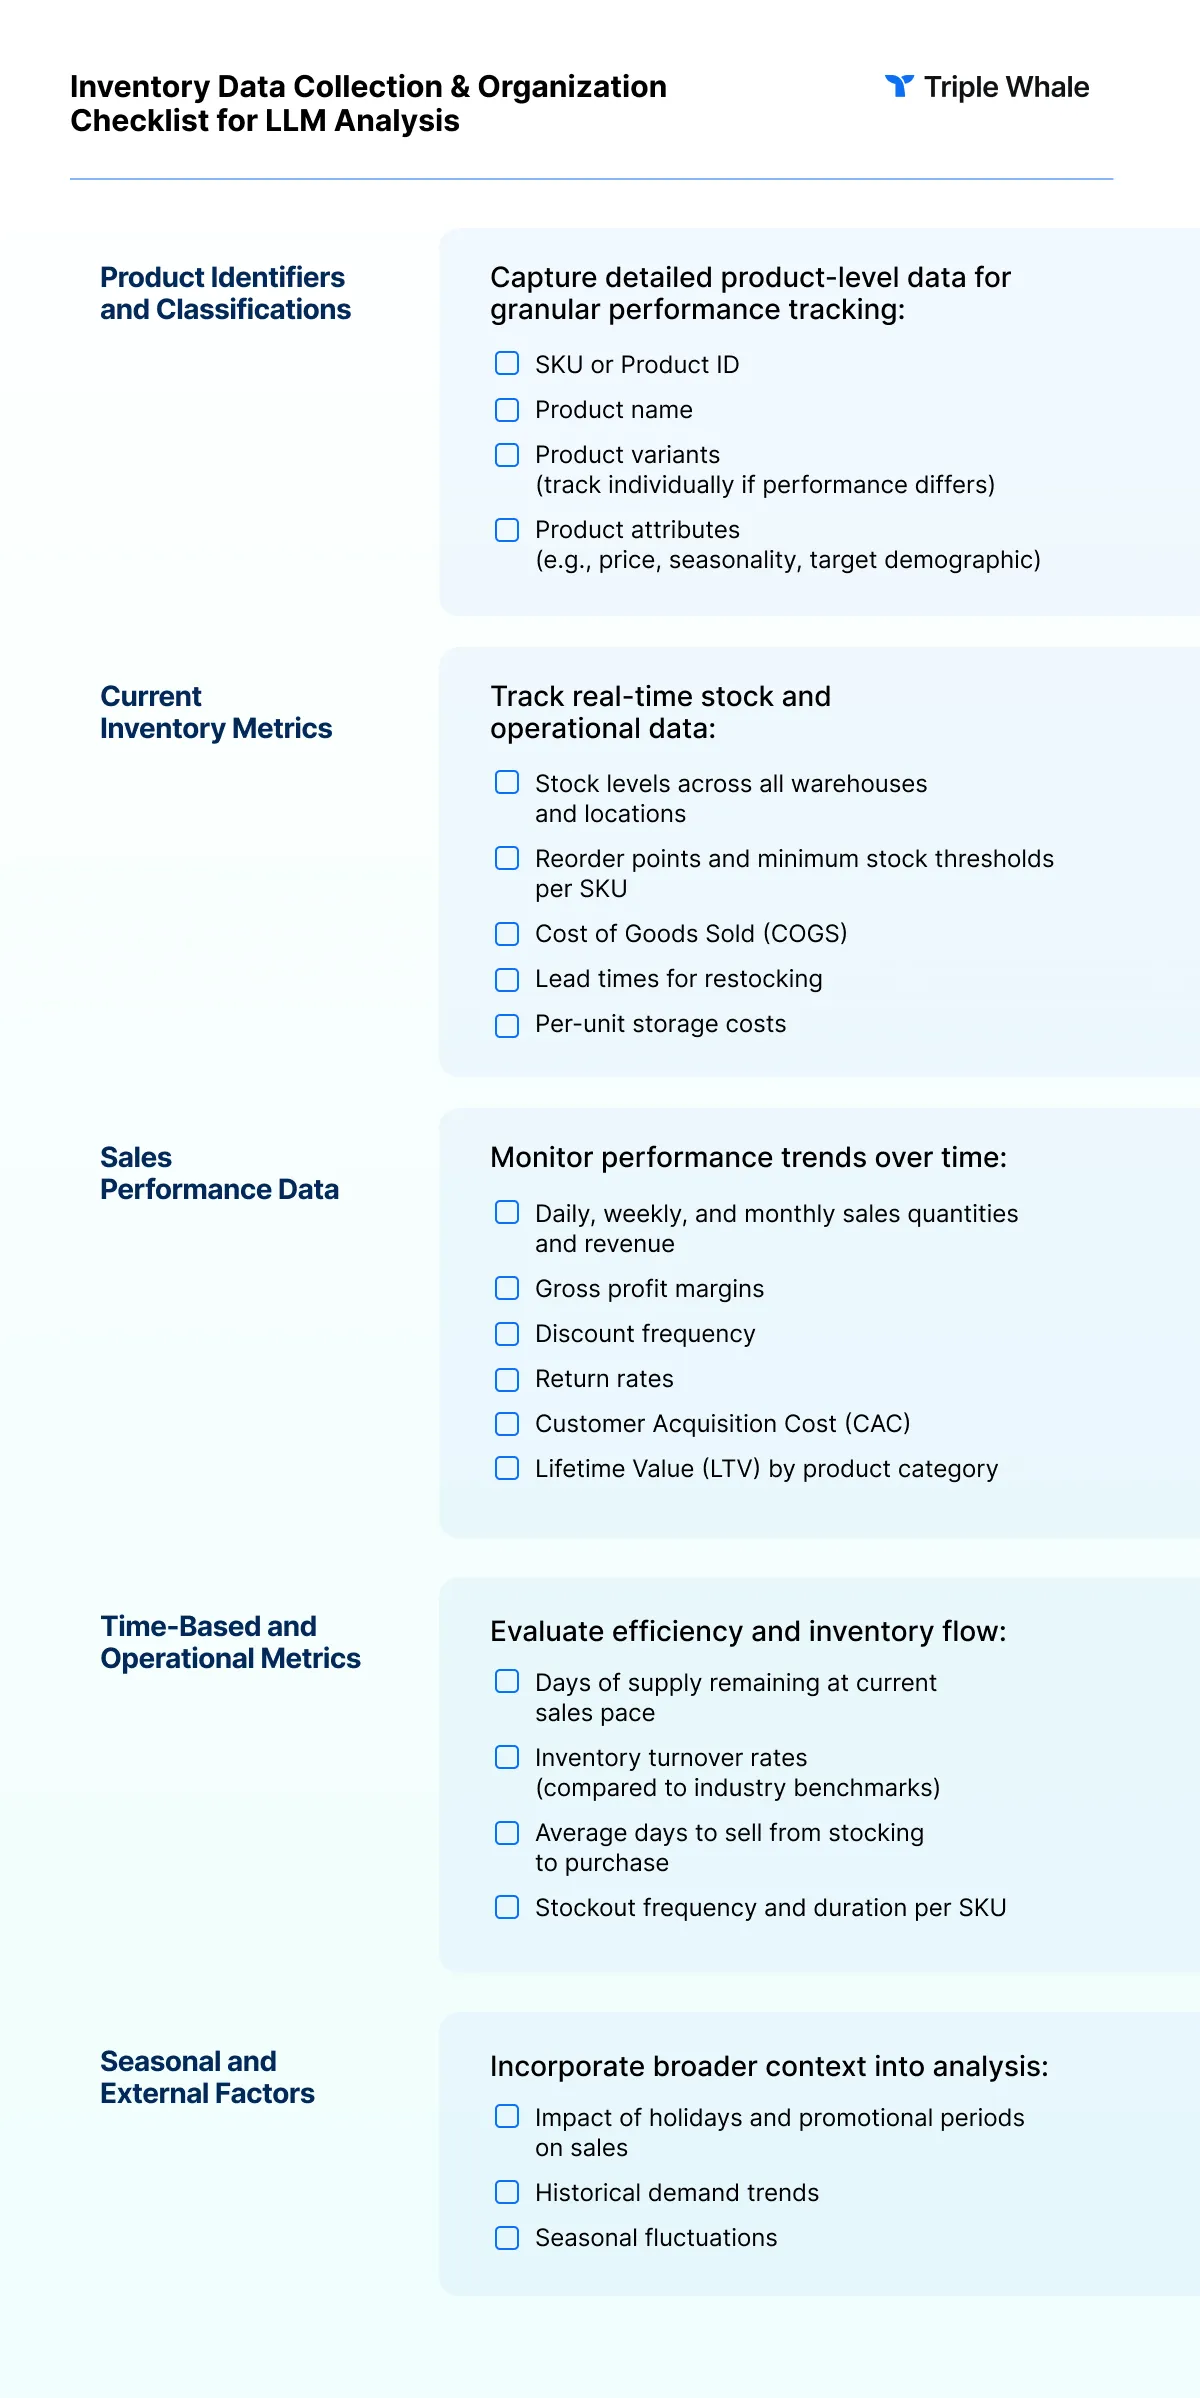
Once you've collected the necessary data, the next step is to structure it in a way that enables efficient, reliable analysis — especially when working with LLMs:
1. Download and consolidate reports
Gather and merge key inventory-related documents:
2. Create comprehensive margin calculations
Build detailed profitability models by including all cost components in your spreadsheet:
3. Structure data for AI analysis
Format your dataset in a machine-readable way:
4. Ensure historical depth
Provide at least 12 months of data to identify trends, account for seasonality, and enable more accurate forecasting.
Once you’ve successfully collected and organized the data, an LLM can provide a sophisticated analysis that would require extensive manual work to achieve otherwise.
Here is a suggested LLM prompt for effectively monitoring and optimizing inventory levels:
# Ecommerce Inventory & Sales Analysis
I've uploaded our inventory and sales data. Please analyze and provide:
## 1. Performance Analysis
- Identify top and bottom 20% of products by:
- Profitability
- Turnover rate
- Total contribution
- Flag high-revenue/low-profit products (and vice versa)
## 2. Demand Forecasting
- Predict next month's sales by product category
- Identify stockout risks for next 30-60 days
## 3. Inventory Optimization
- Recommend optimal stock levels for top 50 SKUs
- Consider lead times and service level targets
- Identify overstocked items for liquidation
## 4. Seasonal Insights
- Analyze seasonal patterns
- Recommend inventory build-up timing for peak periods
- Identify shifting seasonal trends
## 5. Action Items (Next 30 Days)
Prioritize by financial impact with confidence levels:
- Products to reorder immediately
- Products to reduce orders for
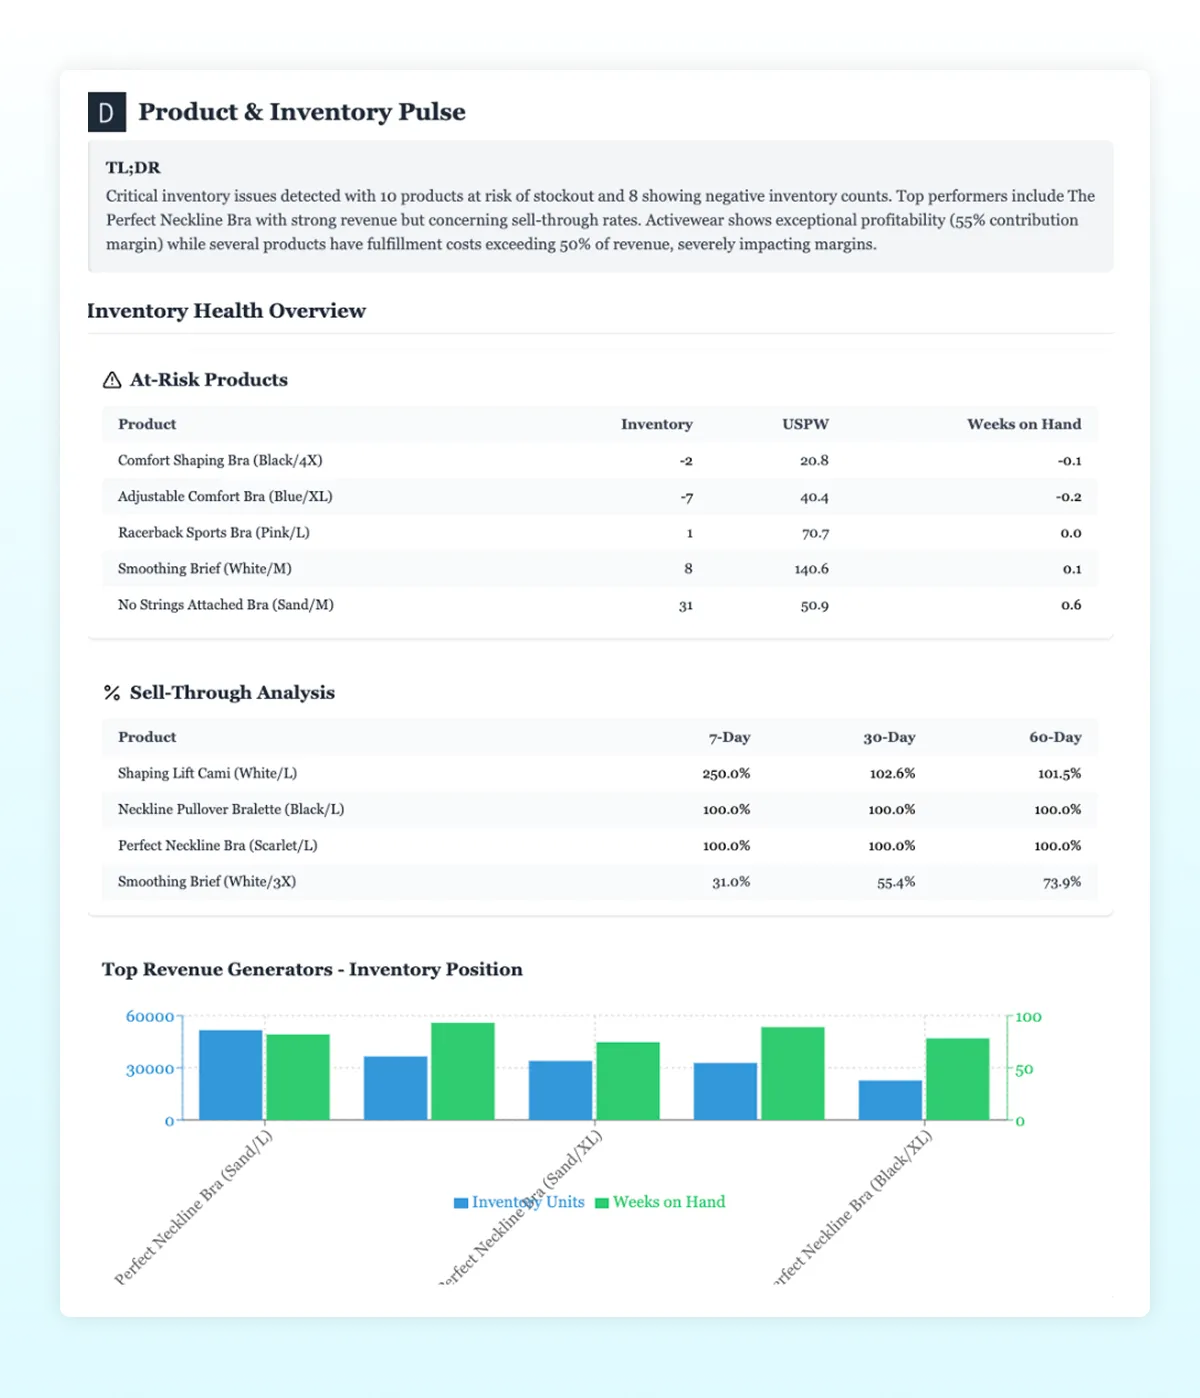
- Pricing/promotional strategies to improve turnoverSimilar to the ad performance analysis, the inventory analysis can also be accomplished automatically with one of Triple Whale’s Agents: the Product & Inventory Pulse Agent.
The Product & Inventory Pulse Agent provides up-to-the-minute data on inventory levels and product performance by synthesizing data from various sources to provide key insights about stock levels, product performance, and demand forecasting. It can quickly identify unusual patterns that could impact your bottom line, and provides tailored suggestions to optimize stock management and improve sales.
How the Product & Inventory Pulse Agent works:
Skip all of the inventory data collection and organization you’d need to complete yourself and instead click ‘run’ on the Product & Inventory Pulse Agent!
Customer lifetime value (LTV) is essential for businesses to stay profitable, yet many businesses don’t keep their finger on that metric as much as they might AOV or conversion rate. LTV is arguably one of the most important metrics to understand what is driving the most long-term value for customers, and can help brands optimize everything from product development to how they allocate their ad spend.
A brand needs to know:
Some products serve as a gateway purchase that leads to repeat business, while others might just be a one-and-done.
Beyond demographics, brands need to understand behavioral patterns, acquisition channels, engagement preferences, and timing of purchases. High-LTV customers often share specific traits that can guide your targeting and retention strategies.
Different acquisition channels often produce customers with vastly different lifetime values. Understanding the differences can allow brands to allocate marketing budget toward the channels that tend to generate more sustainable growth.
To ensure your customer data is optimized for AI-driven insights, use the following checklist to gather and structure all essential information categories.
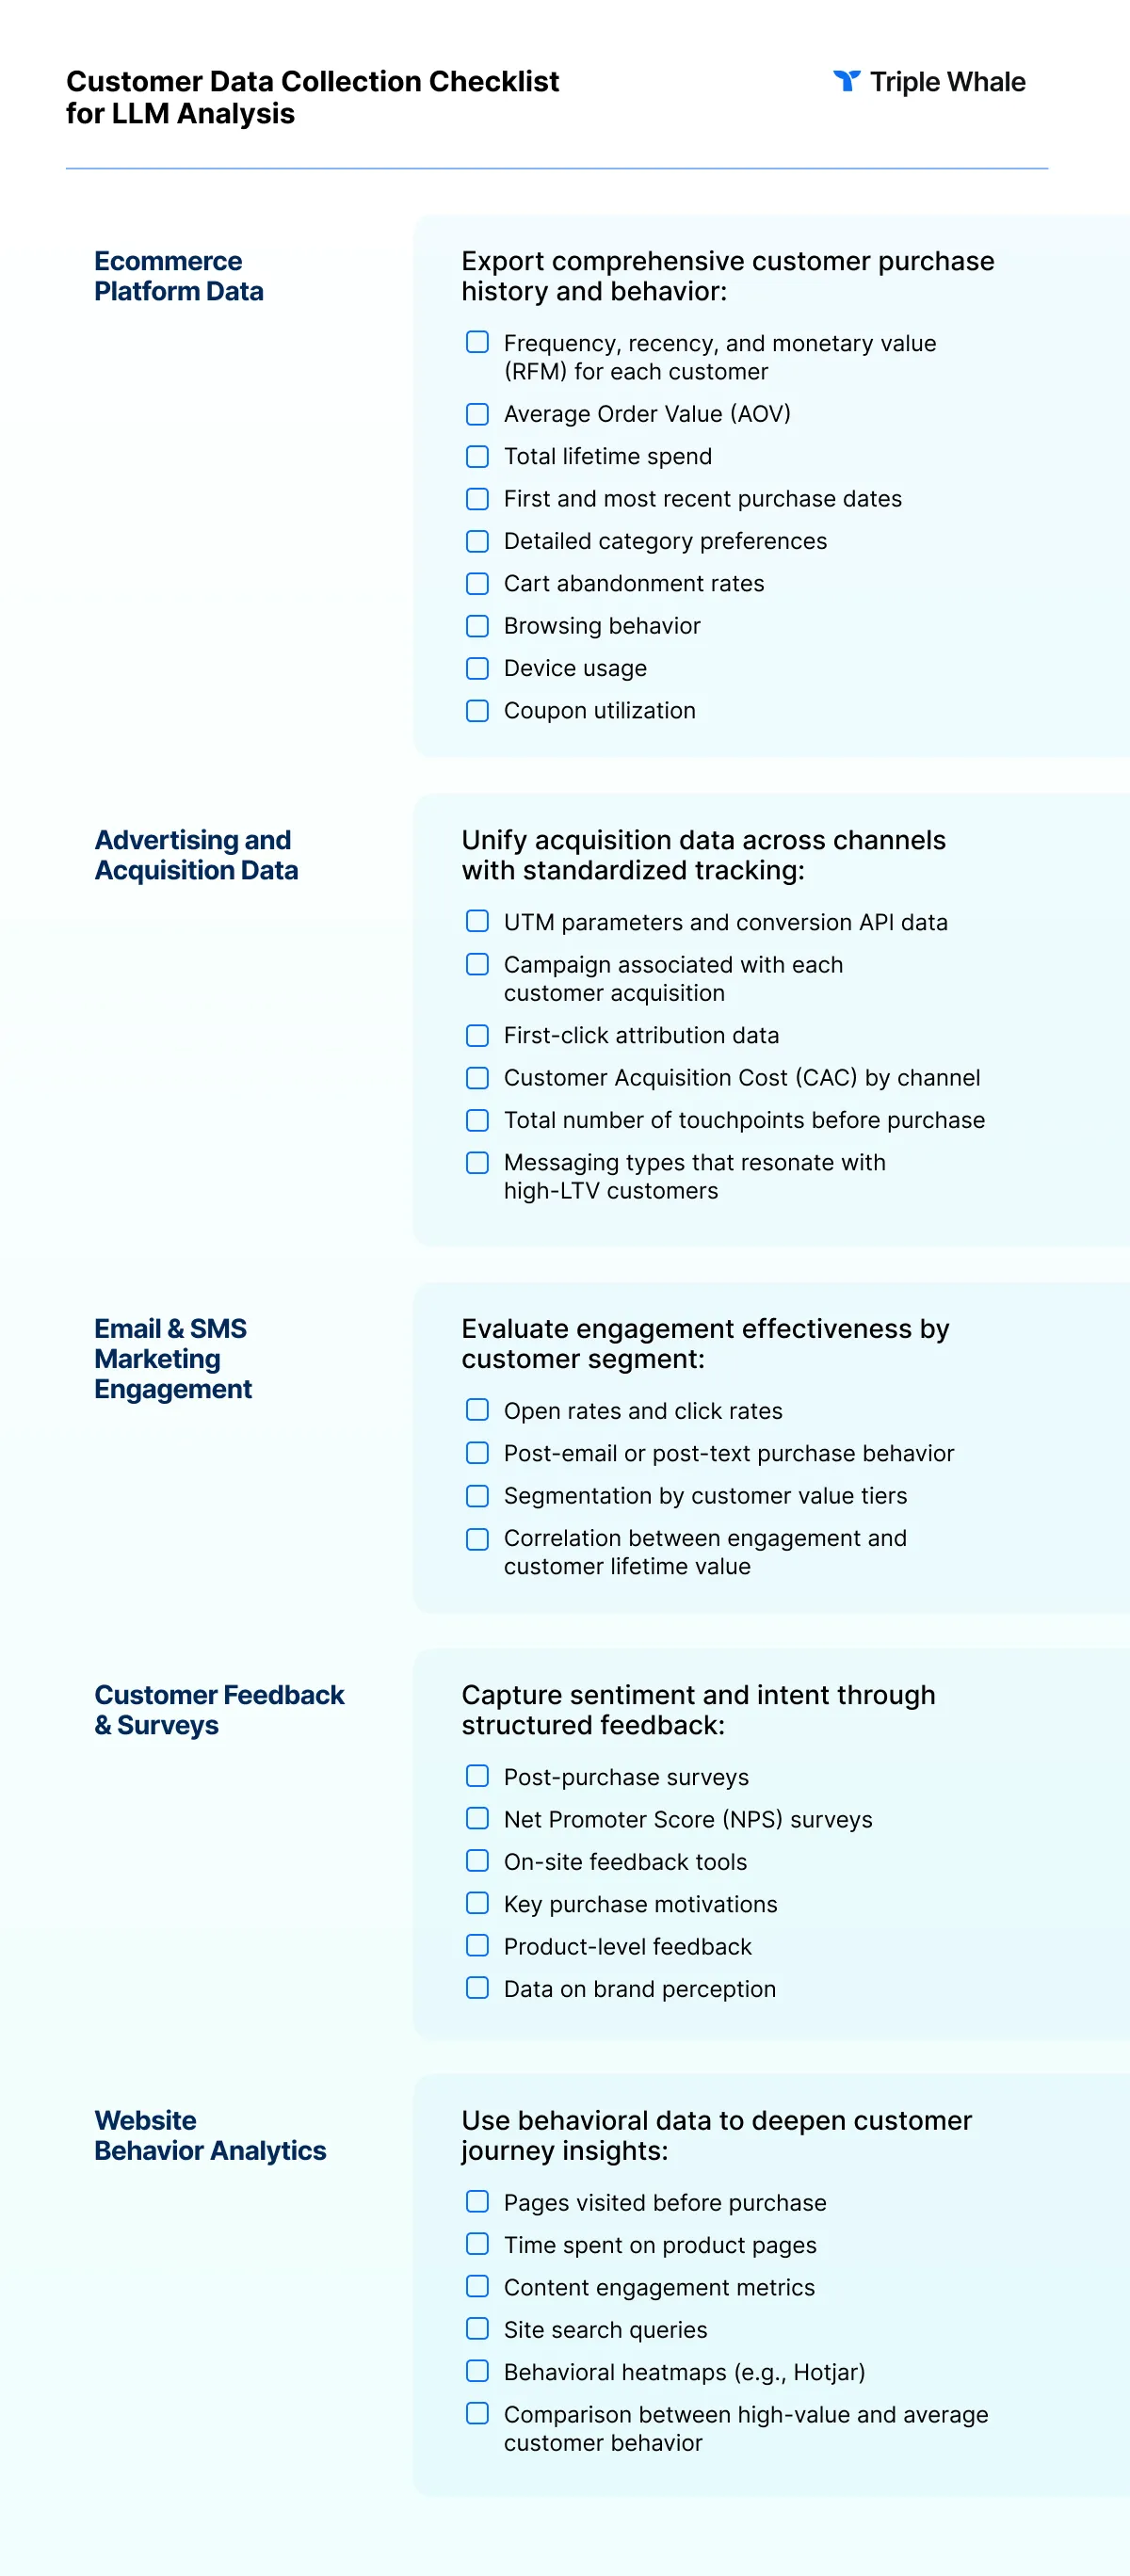
1. Create a unified customer database
Structure data as a CSV file with customer email or order ID as the unique identifier. Each row should represent one customer with columns for all collected metrics. This unified view enables AI to identify patterns across different data sources.
2. Establish customer value segments
Define meaningful customer tiers based on spending and engagement:
3. Map the acquisition journey
Add key fields to reflect the acquisition path:
4. Document behavioral patterns
Include behavioral columns to track recurring engagement traits:
Once you’ve successfully gathered and organized the data, it’s time to prompt the LLM. Here’s an example of a prompt to investigate customer lifetime value:
I've uploaded our customer database with purchase history, acquisition data, and engagement metrics. Please analyze:

## 1. High-Value Customer Profile
- Identify characteristics of top 10% customers by LTV
- Compare their acquisition channels, behaviors, and preferences vs. average customers

## 2. LTV Prediction
- Predict which new customers will become high-value based on first 30-90 days
- Identify strongest early indicators of long-term value

## 3. Channel Performance
- Rank acquisition channels by average customer LTV
- Calculate LTV-to-CAC ratios by channel
- Compare customer behaviors by acquisition source

## 4. Retention Strategy
- Identify at-risk customers
- Recommend retention tactics by customer segment
- Highlight highest-success intervention points

## 5. Growth Recommendations
Prioritize by revenue impact with confidence levels:
- Strategies to increase overall LTV
- Product bundling opportunities
- Communication optimization
- Acquisition channel improvements

Segment all recommendations by implementation difficulty.
There is, of course, a Triple Whale Agent that can do this a lot quicker: the Customer Lifetime Value Analysis Agent. This agent automatically synthesizes customer data into clear insights, helping you identify high-value segments, optimize engagement strategies, and drive retention growth. This agent can inform marketing efforts by understanding what resonates with your audience, and specifically which types of campaigns lead to improved engagement.
How the Customer Lifetime Value Analysis Agent works:
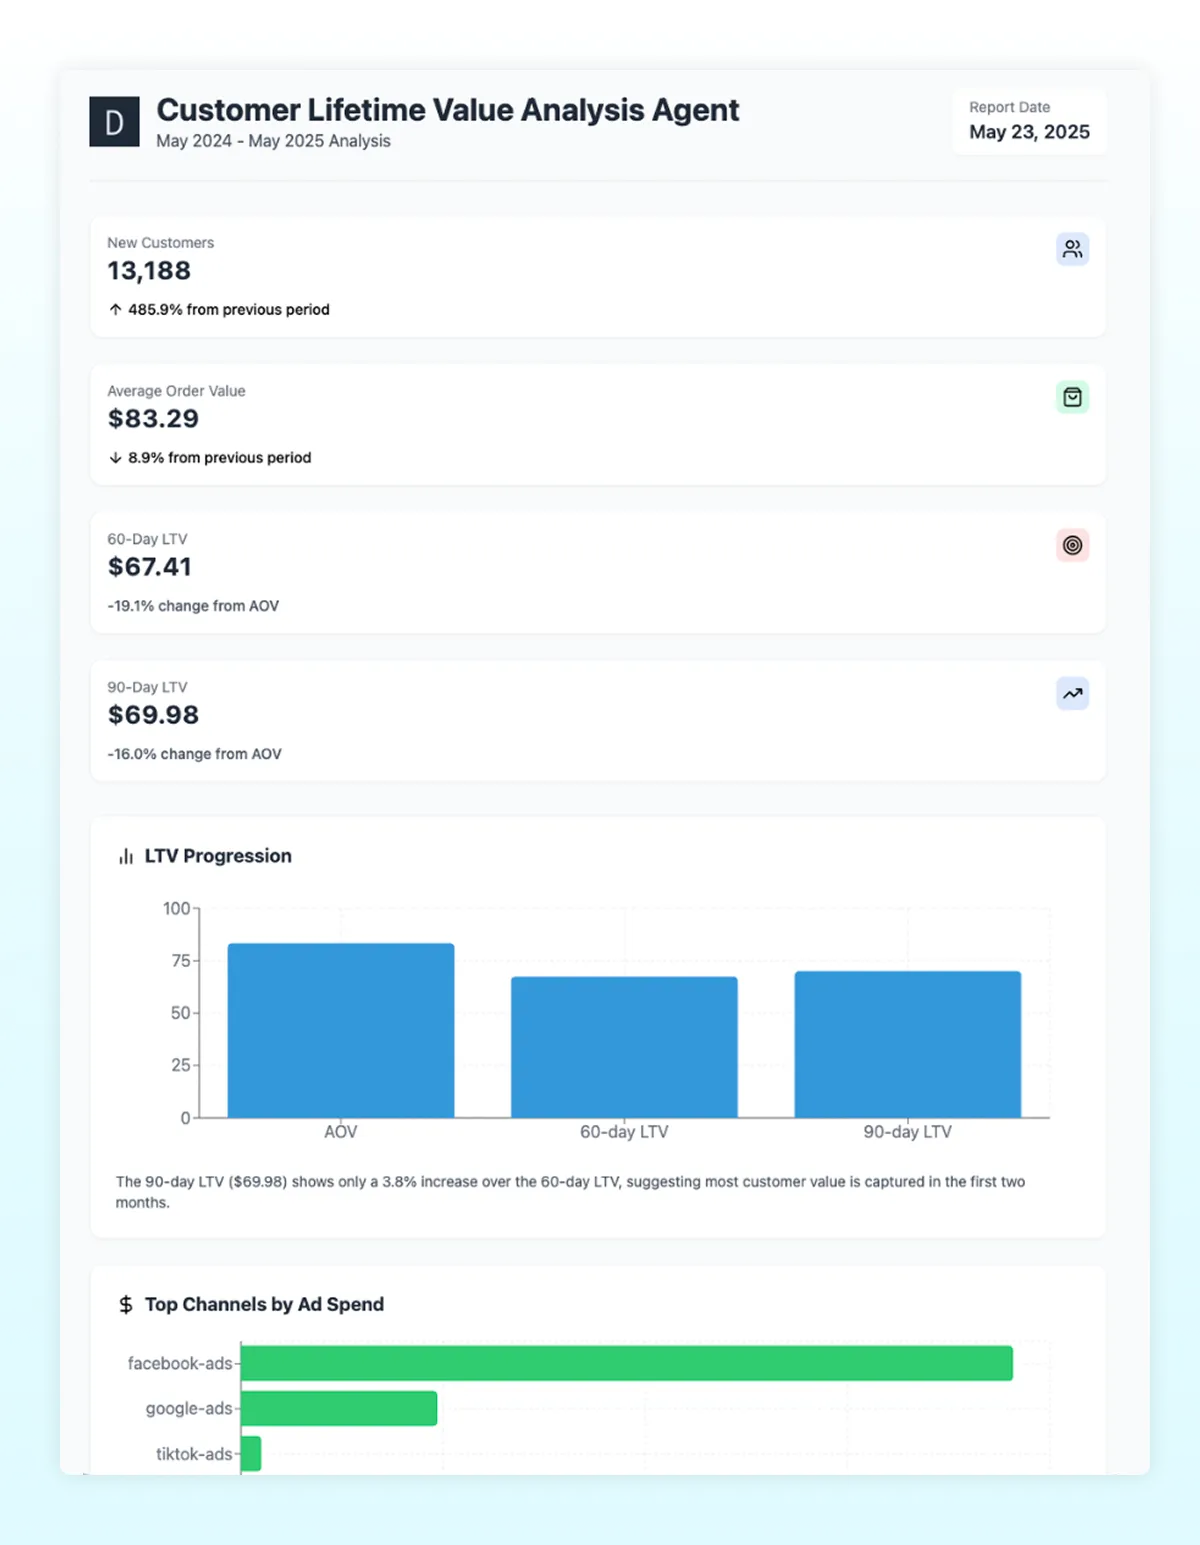
Get details on your most valuable customers quickly and more easily with the Customer Lifetime Value Analysis Agent.
Determining why certain ads succeed and why other ads fail is a task that would take several manual hours of analysis, which is what makes it a great application for LLM analysis. Deconstructing the visual, textual, and structural elements of a brand’s creative can help them understand which components are resonating with their target audience to drive conversions.
The value for this type of analysis is that it combines quantitative performance data from the ad or ecommerce platforms with a qualitative creative assessment. A brand is always able to see which ads have the highest conversion rates, but LLMs can help them understand why certain ads succeed, and how to replicate that success systematically.
A brand needs to know:
It’s not enough to know which ads get clicks or even which generate the most impressions. Brands need to understand which specific creatives are driving actual conversions, and which are acquiring new customers versus just re-engaging existing ones.
High-performing ads often share common visual themes, messaging approaches, or structural elements that aren’t immediately obvious. Understanding these patterns allows a brand to systematically replicate success rather than rely on guesswork for future creative development.
Every underperforming ad represents wasted budget and missed opportunities. Brands need strategies to either optimize existing weak performers or replace them with concepts based on proven successful elements from their best ads.
To prepare your ad creative data for AI-powered analysis, use the checklist below to ensure you’ve captured both performance metrics and creative context across platforms.
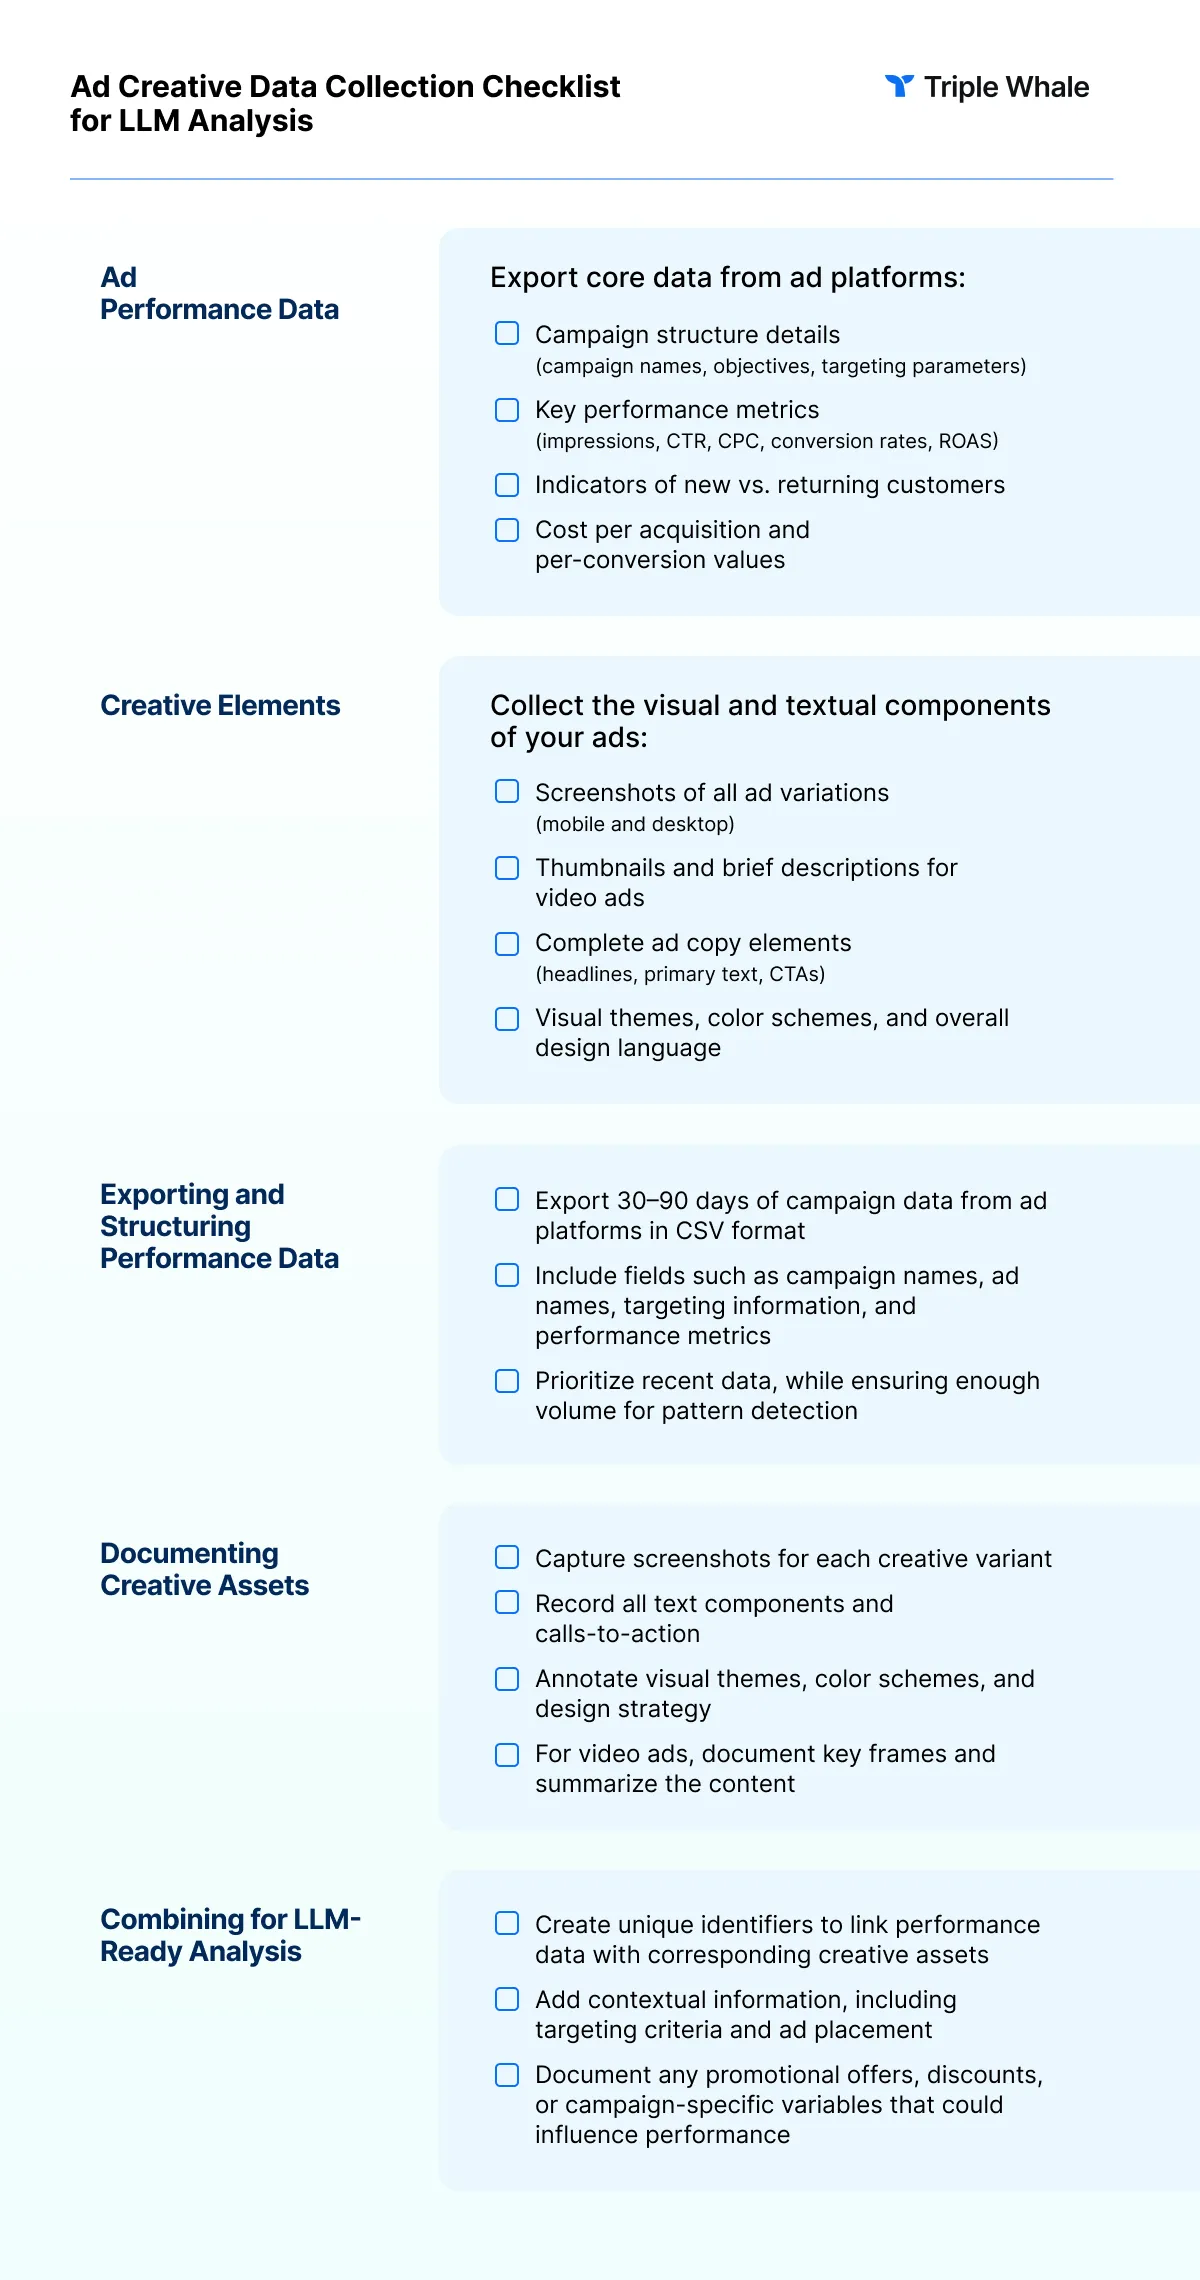
After all of the data is collected and organized, present it to the LLM with a comprehensive prompt as provided here:
# Ad Creative Performance Analysis

I've uploaded 60 days of performance data and creative assets for my advertising campaigns. Please analyze to optimize creative strategy:

## Analysis Goals
- Identify high-converting creative elements
- Find patterns in top-performing ads to replicate
- Pinpoint weaknesses in underperforming ads
- Develop actionable creative recommendations

## Visual Analysis
- What visual themes, colors, and design elements drive performance?
- Which product photography styles convert best?
- How do visuals differ between top and bottom performers?
- What visual mistakes should I avoid?

## Copy Analysis
- Which headline structures and messaging work best?
- What calls-to-action generate highest response rates?
- How does copy length affect performance by ad format?
- What tone and value propositions resonate most?

## Format & Targeting Insights
- Which ad formats perform best by objective?
- How does performance vary by placement?
- Do creative preferences differ across audiences?
- What works best for new customer acquisition vs. retargeting?

## Deliverables
1. **Executive Summary** - Key findings and immediate actions
2. **Performance Comparison** - Side-by-side analysis of top vs. bottom performers
3. **Best Practices Guide** - Creative guidelines based on my data
4. **Improvement Recommendations** - Specific fixes for underperforming ads
5. **Creative Framework** - Template for evaluating future concepts

Include specific examples from my ads with reasoning for each recommendation.
The Meta Creative Strategy Agent can synthesize data to deliver comprehensive reports that highlight key performance metrics, identify trends, and provide actionable recommendations. It is able to transform raw data into clear, actionable reports to guide your advertising strategy, to save hours on manual reporting.
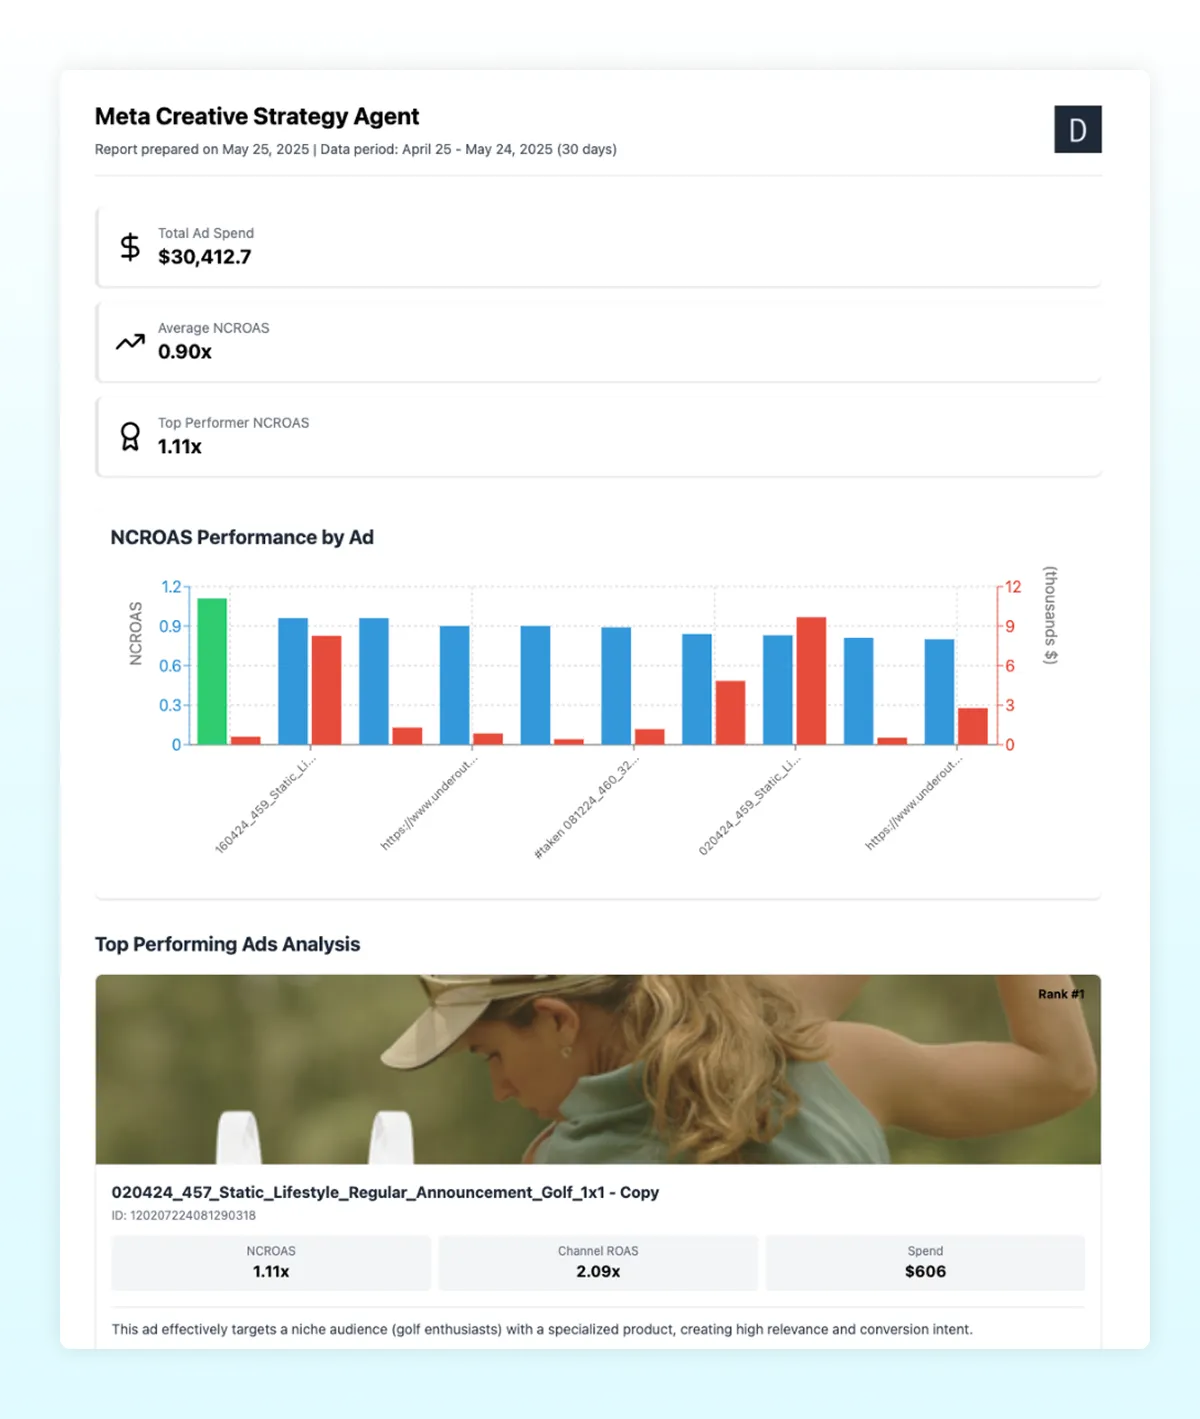
Identify and replicate the strategy of your highest-performing ads with the Meta Creative Strategy Agent.
To get a detailed analysis of video ad performance, you can upload performance metrics downloaded from the ad platform that includes the following data:
When prompting Moby AI, be sure to:
Here is an example of a prompt formatted using Markdown that requests a report on video ad performance:
#Report Title: Best Performing Video Ad Analysis

##Sub-title: Use this analysis to make more winning video ads based on current best performers

##Tertiary-title: Best performing video ads are determined by videos with the lowest drop-off rate in the first 25 seconds.
-You should also provide the data ranges included in this report

#Your Directions
You've been given data and analysis amongst my top video ads.

#Video Performance Metrics Start by providing me with an overview of my video ad performance with the following aggregate metrics

-Average dropoff rate (first 25 seconds)
-Average video views (total video views divided by the number of ads)
-Average video duration
-Total spend on all video ads

Using the video ads with a "dropoff_0s_25" **designation of "low" or "average"**, compile the "video description", "hook description" and "first 25 second description" and summarize the common themes amongst the video ads with a low or average dropoff designation. You should use the video description and the ad copy for this analysis. Make it distinct in your report whether you're describing actions taking place in the video or ad copy.

Provide me with an analysis that describes the common themes from the video description that lead to it being a great video ad. You should bullet list out common themes found in the following parts of the video and any commonalities in the style of the video, actors being used, messaging, psychological principles, voice over, music, etc.

-full video description,
-the "hook" (first three second description),
-the "first 25 seconds" description

#Output Requirements - Build the following sections using the data and insights captured in the previous step

1. Video Performance Metrics
2. Common Success Themes
3. Ads with Low or Average Dropoff Rates

-Display each of the video ads provided in a two-column card view where the **video url is displayed as a square image and is playable upon clicking**. The cards should be displayed side by side, next to eachother as two column and and multiple row matrix with two ads per row. The ad name and ad id should be displayed above the image with the rest of the metrics and descriptions below the video image in bullet format

4. Creative Brief
5. Ads with High Drop Off Rates
-Display each of the video ads provided in a two-column card view where the **video url is displayed as a square image and is playable upon clicking**. The cards should be displayed side by side, next to each other as two column and and multiple row matrix with two ads per row. The ad name and ad id should be displayed above the image with the rest of the metrics and descriptions below the video image in bullet format

Remember that after the qualitative debrief, I want my video image cards displayed as a column x row format (2x) where I have two video image cards per row.
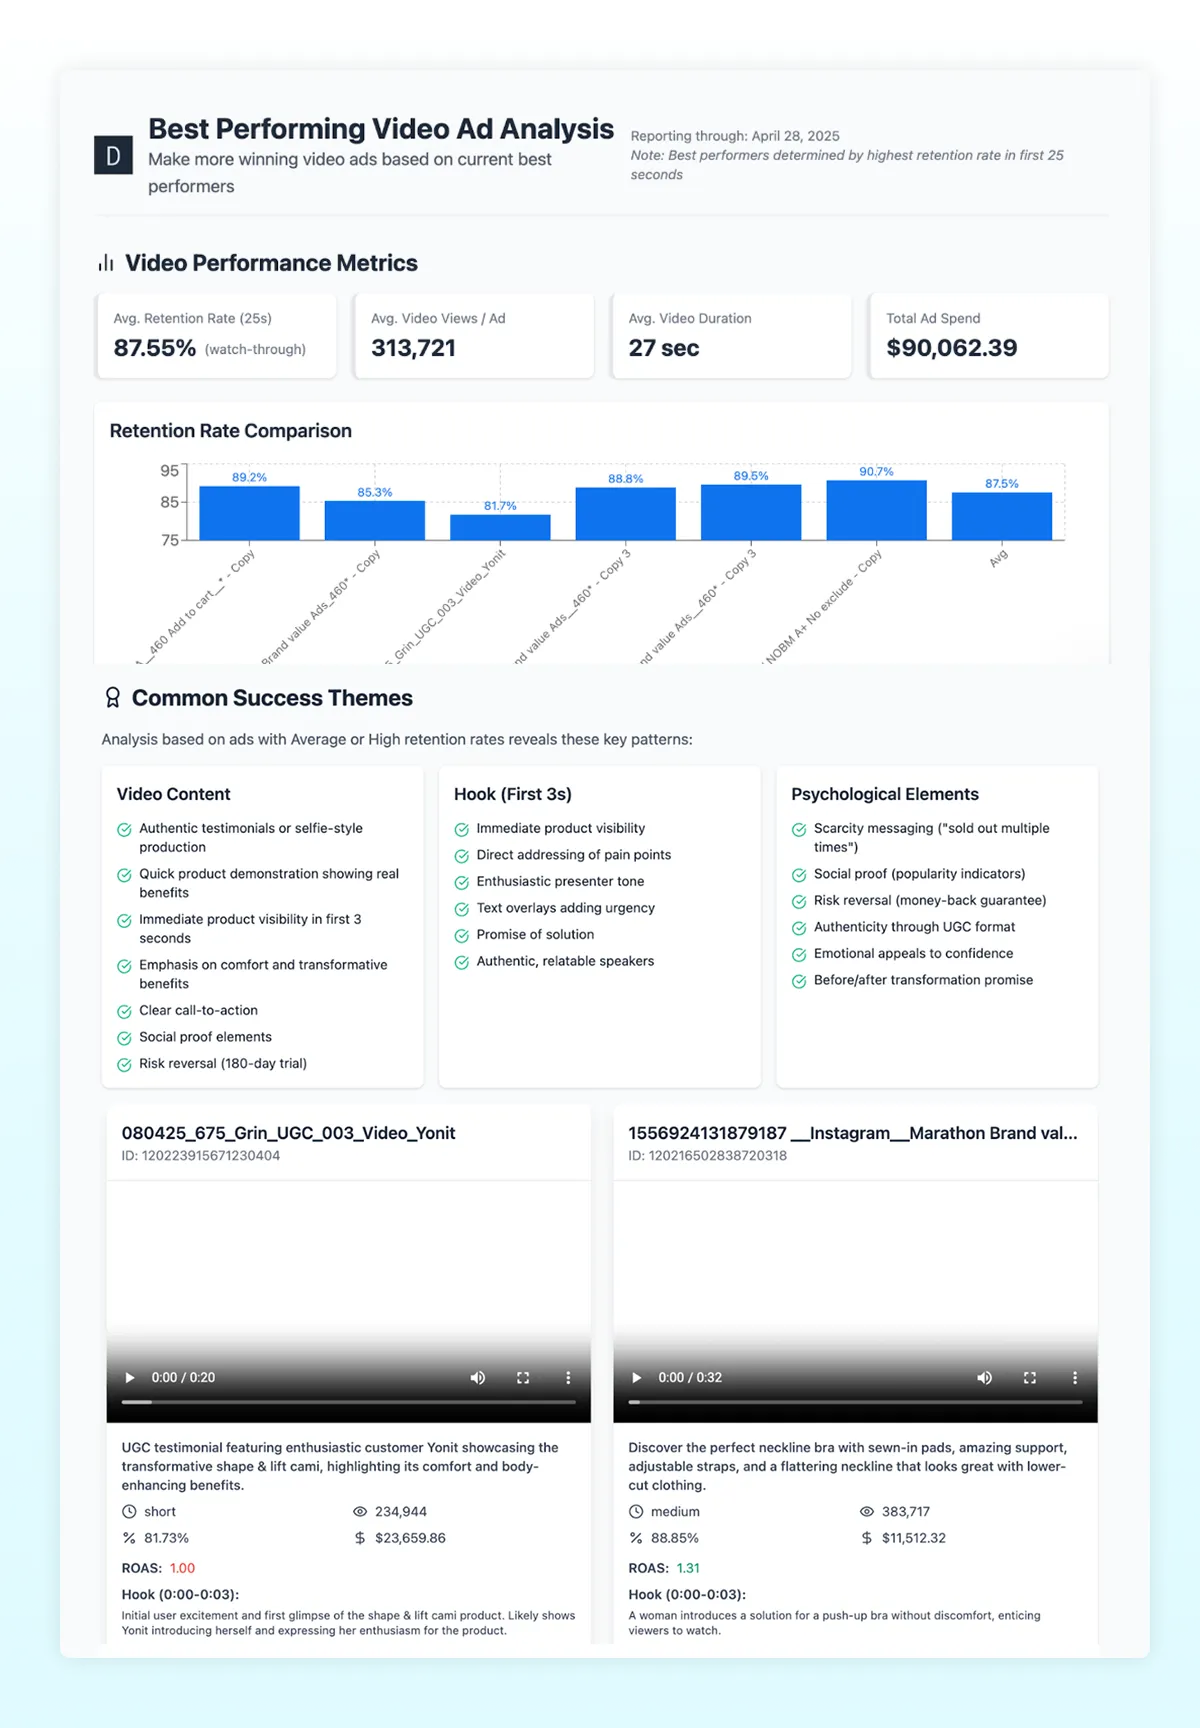
A prompt like this using Moby AI would provide a report that looks like this, and provides clear performance metrics for the video ads, common success themes, and playable files with the video content for easy viewing.
It’s easy to fall off course when you’re operating a fast-paced ecommerce business.
Traditionally, brands would attempt to course correct halfway through the month, when the analyses are finally complete. By the time a brand realizes it’s behind pace to meet month-end goals, it’s too late to adjust advertising spend, inventory decisions, or promotional strategies. There’s a critical need for real-time goal tracking, so you can make informed decisions more quickly.
To build a pacing analysis from the ground up, you need three core data components:
Each component needs to be comprehensive and consistently formatted to enable meaningful analysis.
To run a reliable pacing analysis with an LLM, you first need to collect a complete snapshot of your current performance, historical context, and clearly defined growth targets — all structured in a way that supports accurate comparisons and forecasting.
Essential data to collect:
1. Current performance metrics (month-to-date):
2. Historical comparison data:
3. Clearly defined growth targets:
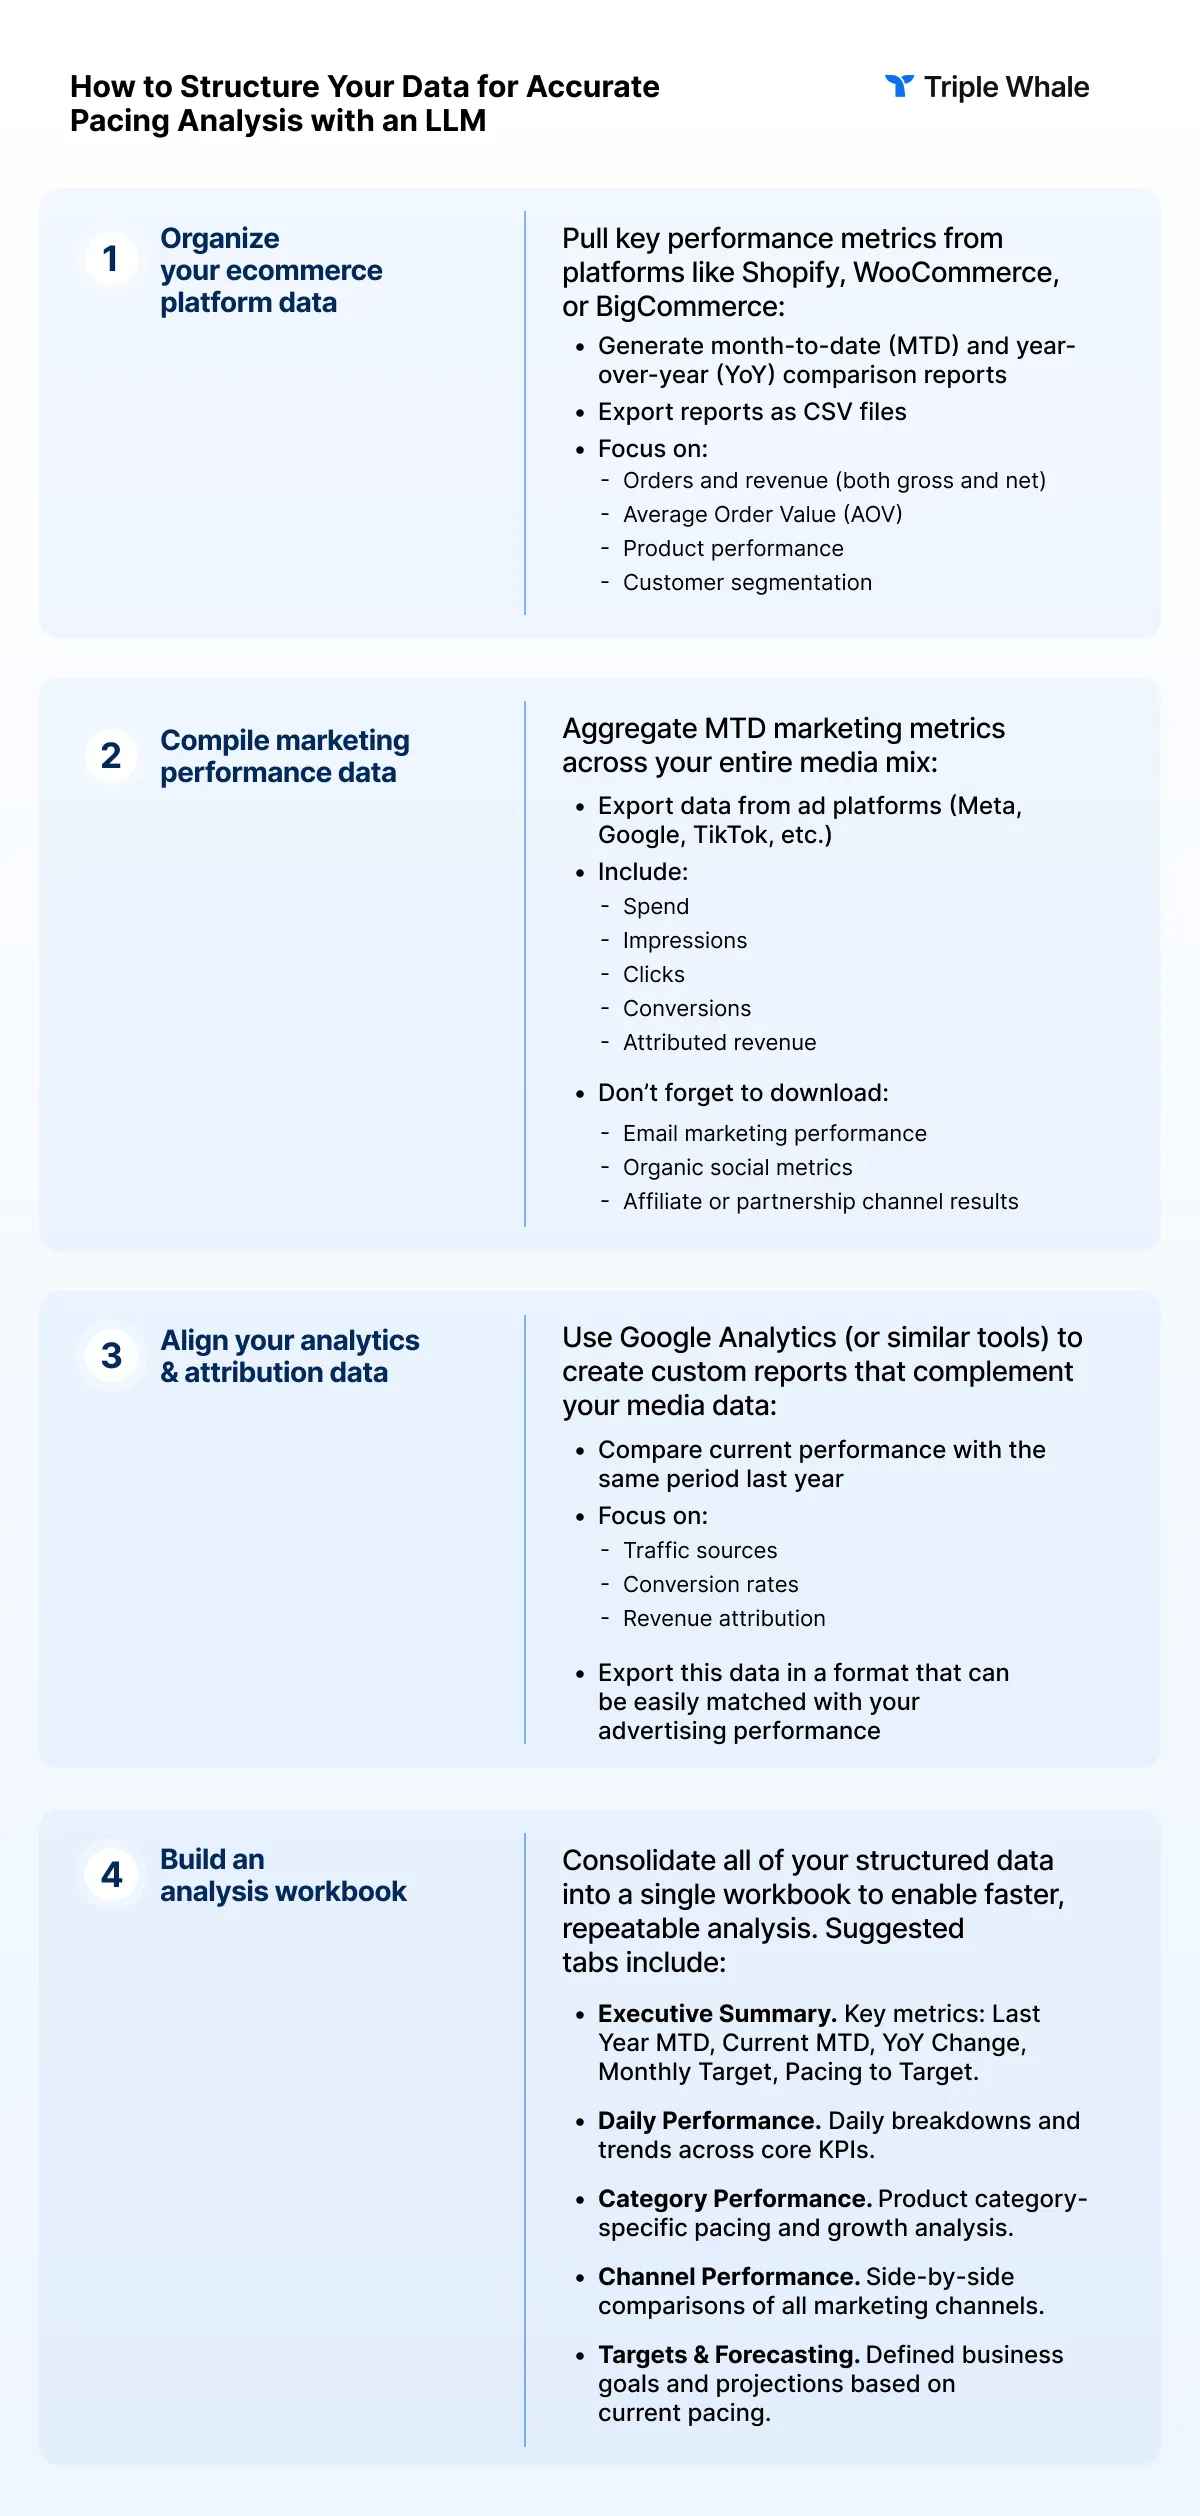
Once you've gathered the right performance, customer, and marketing data, the next step is organizing it in a way that enables reliable, fast-paced analysis. Here's how to structure your datasets and reporting environment so you can get the most out of LLM-powered insights.
With all of this performance data and goals organized, you can request an analysis from the LLM using a prompt like this:
# Month-to-Date Performance Analysis

I've uploaded MTD performance data, YoY comparisons, and growth targets. Please analyze pacing and provide recommendations:

## Performance Assessment
- Are we on track for monthly and annual revenue targets?
- Which metrics show strongest/weakest performance vs. targets?
- What percentage of monthly targets achieved vs. time elapsed?

## Channel & Category Breakdown
- Which marketing channels exceed/underperform expectations?
- Are product categories significantly ahead or behind target?
- How is customer acquisition pacing vs. annual goals?
- Which channels show best/worst ROI currently?

## Forecasting & Trends
- Based on daily trends, forecast end-of-month performance
- Identify concerning downward trends needing attention
- Highlight metrics with positive momentum to capitalize on
- Compare seasonal patterns to last year

## Strategic Recommendations
- What immediate actions improve underperforming areas?
- Where should we increase/decrease ad spend for monthly targets?
- Which promotional or inventory decisions could close gaps?
- How should we reallocate resources between channels?

## Deliverables
1. **Executive Dashboard** - Green/Yellow/Red pacing status
2. **End-of-Month Forecast** - With confidence intervals
3. **Priority Action Plan** - Ranked by impact potential
4. **Budget Reallocation** - Channel recommendations with spend suggestions
5. **Daily Monitoring Checklist** - For remainder of month
6. **Risk Assessment** - Biggest threats to targets

Include specific numbers, percentages, and reasoning for each recommendation.
Of course there’s an agent that can do all of this automatically for you, and it’s called the Performance Pacing Agent. It can quickly analyze current month-to-date performance against year-over-year growth targets and provide a comprehensive, data-driven report that empowers you to make informed decisions and optimize strategies for success.
How the Performance Pacing Agent works:
Want to make performance pacing a whole lot easier? Try the Performance Pacing Agent today.
The above examples are only five of more than 100 dedicated agents that have already been developed by the Triple Whale team to specifically tackle the most common ecommerce data analysis requests. And we’re developing new agents every day!
Moby Agents are ready to help you maximize performance at every stage of your business:
Agentic AI is the latest innovation in artificial intelligence. The Ultimate AI Agents Playbook for Ecommerce Brands will make sure you’re up-to-speed with how AI agents can accelerate your growth!
In short, it saves you a ton of time and energy so you can focus on the more important things–like taking action on all of those intelligent insights. But, in more detail:
The Triple Whale Data Platform is an AI-optimized, fully-managed data warehouse that brings all of your data together as a single source of truth. This universal schema allows brands to conduct real-time data processing at scale.
The ability to pull data from any major ad platform, 3PL and logistics applications, or any number of third-party integrations means all of your data is in one place and up-to-date.
No need to download or upload data at any time, it’s all accessible with a simple prompt in Moby AI. An Agent can run from a single natural language prompt, and instantly produce a visual of your request.
Unlike a standard LLM where you’d have to re-download, organize, then upload new data each day for a new analysis, Moby AI already has all of the information ready for the next query.
We already trained Moby AI on millions of ecommerce interactions and provided Moby AI the context to understand the specific needs, lingo, and nuances of ecommerce data. You don’t have to spend time training the model to get the output you want.
If the 99+ pre-built ecommerce intelligence agents don’t deliver your exact need, you can build an agent yourself using natural language prompts–quickly and easily.
Since agents can continuously monitor your performance, they are able to uncover anomalies in spend, performance, and site behavior far quicker than the average human, and can save you money in places you never would have found on your own.
The estimated number of manual hours required for just the five examples above is 34-51 hours per month – essentially a full work week. For a brand running these analyses, that’s 360-540 hours a year. When you consider how manual analysis can lead to delays in decision-making, the impact of lost time is even more clear.
Ready to make confident, data-driven decisions faster than ever before? Sign up for a demo of Moby Agents today.
While LLMs like ChatGPT and Claude can provide valuable insights when prompted correctly, the manual process of data collection, organization, and analysis remains time-intensive. For ecommerce brands that are serious about moving quickly to scale, Moby Agents can remove that complexity entirely to deliver instant, expert-level analysis without hours of manual labor.
Stop drowning in data and start using it intelligently. Get started with Moby Agents today.
Just by clicking this link, you gave us some data. Every website, every application, and any interaction with an ecommerce brand becomes a data point that a brand can use – if it knows how.
But the amount of data collected doesn’t always correlate with value, and many brands are turning to generative AI and LLMs (large language models) — like ChatGPT and Claude — to turn that data into actionable intelligence. LLMs can help analyze data quickly and adapt to unique business requests, but there are specific guidelines an ecommerce brand should follow in order to obtain the best results possible with the power of generative AI.
In this article, we’ll explore:
Finally, we’ll introduce you to the next generation of ecommerce intelligence with agentic AI, and the Moby Agents that are trained on ecommerce data and ready to uncover powerful insights more quickly, with no data collection, preparation, or prompting required.
A comprehensive breakdown of what agentic AI is and how AI agents can help you grow and scale your ecommerce business is here: The Ultimate AI Agents Playbook for Ecommerce Brands.
Remember how we said most brands are just drowning in data?
We consider LLMs to be a bit of a life raft. An LLM can take the raw data you plug into it and uncover some insights you may not have seen initially (or ever) because you weren’t sure what you were looking at.
There are several applications for LLMs to optimize an ecommerce brand, but to name a few:
While they’re powerful, LLMs can’t access your data directly.
You’ll need to export data from various platforms, prepare it in a way the LLM can understand, and craft a prompt that will provide the response you need. Because these tools don’t have access or real-time connections to your Shopify store, advertising accounts, Google Analytics, and more, they are limited in the insights they can provide.
The quality of the insights depends on the quality and completeness of the data you provide to the LLM.
LLMs also can’t make any business decisions for you, nor can they guarantee the accuracy of the predictions they make. They work best as partners to help you understand your data and to generate hypotheses, but the strategic decisions will remain in your hands.
Unlike ChatGPT and Claude, Triple Whale’s Moby Chat Need to know something about your data? Just ask. Try Moby Chat to get instant business-specific insights from your always-on smart assistant. Moby has direct access to your data, and is basically an ecommerce-trained generative AI tool that already understands the nuances of ecommerce.
The foundation is the Triple Whale Data Platform, which combines all of the ecommerce data you have available to pull all of your metrics into a single source of truth. It is also layered with sophisticated attribution models, forecasting abilities, and the business intelligence tools to analyze your data from every angle.
Moby is the only AI that understands ecommerce, and is able to revolutionize the way you access and analyze your data.
Need to know something about your data? Just ask. Try Moby Chat to get instant business-specific insights from your always-on smart assistant.
To be successful with LLMs, you need to understand how they process information and structure your requests in a way that most effectively produces your desired end result.
To provide valuable insights, the LLM needs extremely clear directions.
Here are some general guidelines:
When in doubt about how to formulate a prompt, remember that it should be measurable, obtainable, bounded, and yielding. We like to use the acronym MOBY:
The quality of the analysis an LLM delivers is directly connected to the quality of the data it is provided with.
The data preparation phase is crucial, and it will represent the difference between receiving generic observations and actionable intelligence to move your business forward.
Below are some guidelines for collecting, organizing, and getting data ready for LLM analysis.
1. Start by identifying all key data sources relevant to your business
2. Set up proper data export capabilities to ensure you can access data in usable formats
3. Before diving into analysis, confirm that your tracking infrastructure is correctly set up
1. Standardize your data format by creating consistent naming conventions
2. Group your data into logical, analysis-ready structures
3. Clean and validate data to ensure data quality
1. Build reusable templates for common analysis needs
2. Include contextual information for AI analyses
When using tools like ChatGPT or Claude, always provide relevant context to improve analysis quality:
You could skip the many steps required to download, clean, and organize your data by using AI agents. Learn more in The Ultimate AI Agents Playbook!
As evidenced by many prompts gone wrong or halfway to what you expected, crafting an effective prompt is both an art and a science. The best prompts combine clear business objectives with structured data requests and specific output requirements. If a prompt follows this approach, it is more likely to deliver insights that are actionable immediately, rather than generic observations that will require additional interpretation.
Since ecommerce analysis typically involves multiple variables and competing priorities, the prompting strategy should reflect the complexity of decision-making involved. Simple question-and-answer scenarios aren’t often useful, and effective prompts will provide the generative AI model with enough structure to deliver valuable insights.
Here are some guidelines for how to prompt LLMs:
Instead of: “analyze my data”
Use:
Analyze my Q4 sales data to identify which product categories had the strongest growth, what customer segments drove the most revenue, and where I should focus inventory investment for Q1.The questions you ask an LLM make all the difference. For example:
Always ask for:
The following examples demonstrate how to apply LLM analysis to a few common ecommerce challenges:
Each example will include the business context, data preparation requirements, and some detailed prompts you can adapt for your specific needs. These are templates and not scripts to be followed exactly. As each business has unique characteristics, these should be reflected in how you structure your analysis requests and interpret the results. Adapt, iterate, and refine the prompts to get the exact output you’re hoping to achieve.
A modern ecommerce brand is advertising on multiple platforms with budgets spread across Facebook, Google Ads, TikTok, and more – which can make it very difficult to decipher just how effective any one ad (or any one platform) is for the brand as a whole.
A brand needs to know:
It’s not just about cost-per-click or number of impressions, but instead the brand needs to determine if the ad spend it generating meaningful business outcomes at a sustainable cost. Beyond individual campaign performance, it’s important to understand how different platforms complement each other in the overall marketing funnel.
While one platform may drive high awareness, another might be better for converting customers. Understanding how the overall funnel works will allow a brand to budget funds for platforms based on specific business needs.
A dynamic budget allocation can respond to real performance data rather than gut feelings or outdated assumptions. But, in order to accomplish that, a brand must understand both their current performance and historical trends in order to make decisions about where to decrease or maintain spending.
To get a comprehensive view of advertising performance across platforms, a brand must build a system that compiles all of the essential metrics from each platform in the same place:
Once all of the data is organized, the LLM will be able to transform the raw data into insights that might take hours to identify manually.
Here is a suggested LLM prompt for evaluating ad performance across data platform:
# Ad Performance Data Analysis Request

## Context
I have comprehensive advertising performance data across multiple platforms for both 30-day and 365-day periods. I need actionable insights to optimize ad spend allocation and improve overall performance.

## Your Role
Act as a senior digital marketing analyst with expertise in performance marketing, budget optimization, and cross-platform advertising strategy.

## Analysis Framework
Please conduct a systematic analysis following this structure:

### Performance Efficiency Assessment
- Calculate and rank platforms by ROAS (highest to lowest)
- Identify cost per acquisition leaders and laggards
- Evaluate cost efficiency for impressions and clicks
- Flag platforms with spending inefficiencies

### Customer Acquisition Analysis
- Segment new vs. repeat customer acquisition by platform
- Calculate true cost per new customer by platform
- Assess customer lifetime value by acquisition source

### Budget Optimization Strategy
- Recommend budget reallocation based on performance data
- Identify platforms for increased/decreased investment
- Suggest optimal budget percentage distribution
- Identify spending caps due to diminishing returns

### Trend & Pattern Recognition
- Compare 365-day vs. 30-day performance shifts
- Identify platforms with positive/negative momentum
- Note seasonal patterns affecting performance
- Highlight concerning metric declines

## Required Outputs

### Format Requirements
1. Executive Summary (3-4 key findings + primary budget recommendation)
2. Platform Scorecard (Letter grades A-F with 2-3 bullet justifications each)
3. Budget Allocation Table (Specific percentages/amounts with current vs. recommended)
4. Action Priority Matrix (Top 5 actions ranked by impact/urgency)

### Analysis Standards
- Support all recommendations with specific data points
- Include confidence levels for major recommendations (High/Medium/Low)
- Provide reasoning for each letter grade assignment
- Quantify potential impact where possible (e.g., "could improve ROAS by X%")

## Data Interpretation Guidelines
- Prioritize statistical significance over absolute numbers for smaller platforms
- Consider platform maturity when evaluating performance
- Factor in attribution windows and measurement differences
- Account for seasonal business patterns in trend analysis

Please begin your analysis once I provide the data.
As you can see, this is a very detailed and organized prompt that requires accurately compiled data to produce useful results.
Here's what the output of that exact prompt would look like in Moby Chat, which automatically accesses your brand's data, no uploading required.
With Triple Whale, all of the data is already compiled accurately for this analysis, and there is even an agent available to automatically run analyses to evaluate ad performance across platforms, and it’s called the Channel Budget Allocation Agent.
The Channel Budget Allocation Agent provides real-time, optimal budget distribution across marketing channels. It is able to analyze performance data and spending efficiency over the past 30 and 365 days.
Focusing on metrics like spend, ROAS, and conversion values, the Agent can help a brand maximize returns and adjust recommendations for budget allocation based on current performance as well as historical trends.
How the Channel Budget Allocation Agent works:
Want to skip all of the data collection, organization, and prompt crafting required to do this analysis in an LLM yourself? Give the Channel Budget Allocation Agent a try today.
Proper inventory management is essential for an ecommerce brand, because an overstock of products ties up cash flow and hikes up storage costs, and too little inventory means missed sales and frustrated customers. With thousands of SKUs across multiple categories, each product could even have different demand patterns, seasonality, and profit margins.
A brand needs to know:
Understanding top sellers versus slow movers should also consider profit margins, inventory turnover, and storage costs. A high-revenue product that sits in a warehouse for months might be less valuable than a lower-revenue item that turns over weekly.
Sudden sales spikes could indicate viral social mentions, stockouts from competitors, or the early stages of a trending product category. Being able to identify these patterns early allows you to capitalize on opportunities or prepare for demand shifts ahead of time.
Accurate forecasting is a cornerstone of efficient inventory management. This means understanding not just the historical patterns but how external factors like seasonality, marketing campaigns, and market trends influence demand for each product.
To effectively prepare your inventory data for LLM-powered analysis, start by collecting and organizing the following key categories:
Once you've collected the necessary data, the next step is to structure it in a way that enables efficient, reliable analysis — especially when working with LLMs:
1. Download and consolidate reports
Gather and merge key inventory-related documents:
2. Create comprehensive margin calculations
Build detailed profitability models by including all cost components in your spreadsheet:
3. Structure data for AI analysis
Format your dataset in a machine-readable way:
4. Ensure historical depth
Provide at least 12 months of data to identify trends, account for seasonality, and enable more accurate forecasting.
Once you’ve successfully collected and organized the data, an LLM can provide a sophisticated analysis that would require extensive manual work to achieve otherwise.
Here is a suggested LLM prompt for effectively monitoring and optimizing inventory levels:
# Ecommerce Inventory & Sales Analysis

I've uploaded our inventory and sales data. Please analyze and provide:

## 1. Performance Analysis
- Identify top and bottom 20% of products by:
  - Profitability
  - Turnover rate
  - Total contribution
- Flag high-revenue/low-profit products (and vice versa)

## 2. Demand Forecasting
- Predict next month's sales by product category
- Identify stockout risks for next 30-60 days

## 3. Inventory Optimization
- Recommend optimal stock levels for top 50 SKUs
- Consider lead times and service level targets
- Identify overstocked items for liquidation

## 4. Seasonal Insights
- Analyze seasonal patterns
- Recommend inventory build-up timing for peak periods
- Identify shifting seasonal trends

## 5. Action Items (Next 30 Days)
Prioritize by financial impact with confidence levels:
- Products to reorder immediately
- Products to reduce orders for
- Pricing/promotional strategies to improve turnover
Similar to the ad performance analysis, the inventory analysis can also be accomplished automatically with one of Triple Whale’s Agents: the Product & Inventory Pulse Agent.
The Product & Inventory Pulse Agent provides up-to-the-minute data on inventory levels and product performance by synthesizing data from various sources to provide key insights about stock levels, product performance, and demand forecasting. It can quickly identify unusual patterns that could impact your bottom line, and provides tailored suggestions to optimize stock management and improve sales.
How the Product & Inventory Pulse Agent works:
Skip all of the inventory data collection and organization you’d need to complete yourself and instead click ‘run’ on the Product & Inventory Pulse Agent!
Customer lifetime value (LTV) is essential for businesses to stay profitable, yet many businesses don’t keep their finger on that metric as much as they might AOV or conversion rate. LTV is arguably one of the most important metrics to understand what is driving the most long-term value for customers, and can help brands optimize everything from product development to how they allocate their ad spend.
A brand needs to know:
Some products serve as a gateway purchase that leads to repeat business, while others might just be a one-and-done.
Beyond demographics, brands need to understand behavioral patterns, acquisition channels, engagement preferences, and timing of purchases. High-LTV customers often share specific traits that can guide your targeting and retention strategies.
Different acquisition channels often produce customers with vastly different lifetime values. Understanding the differences can allow brands to allocate marketing budget toward the channels that tend to generate more sustainable growth.
To ensure your customer data is optimized for AI-driven insights, use the following checklist to gather and structure all essential information categories.
1. Create a unified customer database
Structure data as a CSV file with customer email or order ID as the unique identifier. Each row should represent one customer with columns for all collected metrics. This unified view enables AI to identify patterns across different data sources.
2. Establish customer value segments
Define meaningful customer tiers based on spending and engagement:
3. Map the acquisition journey
Add key fields to reflect the acquisition path:
4. Document behavioral patterns
Include behavioral columns to track recurring engagement traits:
Once you’ve successfully gathered and organized the data, it’s time to prompt the LLM. Here’s an example of a prompt to investigate customer lifetime value:
I've uploaded our customer database with purchase history, acquisition data, and engagement metrics. Please analyze:

## 1. High-Value Customer Profile
- Identify characteristics of top 10% customers by LTV
- Compare their acquisition channels, behaviors, and preferences vs. average customers

## 2. LTV Prediction
- Predict which new customers will become high-value based on first 30-90 days
- Identify strongest early indicators of long-term value

## 3. Channel Performance
- Rank acquisition channels by average customer LTV
- Calculate LTV-to-CAC ratios by channel
- Compare customer behaviors by acquisition source

## 4. Retention Strategy
- Identify at-risk customers
- Recommend retention tactics by customer segment
- Highlight highest-success intervention points

## 5. Growth Recommendations
Prioritize by revenue impact with confidence levels:
- Strategies to increase overall LTV
- Product bundling opportunities
- Communication optimization
- Acquisition channel improvements

Segment all recommendations by implementation difficulty.
There is, of course, a Triple Whale Agent that can do this a lot quicker: the Customer Lifetime Value Analysis Agent. This agent automatically synthesizes customer data into clear insights, helping you identify high-value segments, optimize engagement strategies, and drive retention growth. This agent can inform marketing efforts by understanding what resonates with your audience, and specifically which types of campaigns lead to improved engagement.
How the Customer Lifetime Value Analysis Agent works:
Get details on your most valuable customers quickly and more easily with the Customer Lifetime Value Analysis Agent.
Determining why certain ads succeed and why other ads fail is a task that would take several manual hours of analysis, which is what makes it a great application for LLM analysis. Deconstructing the visual, textual, and structural elements of a brand’s creative can help them understand which components are resonating with their target audience to drive conversions.
The value for this type of analysis is that it combines quantitative performance data from the ad or ecommerce platforms with a qualitative creative assessment. A brand is always able to see which ads have the highest conversion rates, but LLMs can help them understand why certain ads succeed, and how to replicate that success systematically.
A brand needs to know:
It’s not enough to know which ads get clicks or even which generate the most impressions. Brands need to understand which specific creatives are driving actual conversions, and which are acquiring new customers versus just re-engaging existing ones.
High-performing ads often share common visual themes, messaging approaches, or structural elements that aren’t immediately obvious. Understanding these patterns allows a brand to systematically replicate success rather than rely on guesswork for future creative development.
Every underperforming ad represents wasted budget and missed opportunities. Brands need strategies to either optimize existing weak performers or replace them with concepts based on proven successful elements from their best ads.
To prepare your ad creative data for AI-powered analysis, use the checklist below to ensure you’ve captured both performance metrics and creative context across platforms.
After all of the data is collected and organized, present it to the LLM with a comprehensive prompt as provided here:
# Ad Creative Performance Analysis

I've uploaded 60 days of performance data and creative assets for my advertising campaigns. Please analyze to optimize creative strategy:

## Analysis Goals
- Identify high-converting creative elements
- Find patterns in top-performing ads to replicate
- Pinpoint weaknesses in underperforming ads
- Develop actionable creative recommendations

## Visual Analysis
- What visual themes, colors, and design elements drive performance?
- Which product photography styles convert best?
- How do visuals differ between top and bottom performers?
- What visual mistakes should I avoid?

## Copy Analysis
- Which headline structures and messaging work best?
- What calls-to-action generate highest response rates?
- How does copy length affect performance by ad format?
- What tone and value propositions resonate most?

## Format & Targeting Insights
- Which ad formats perform best by objective?
- How does performance vary by placement?
- Do creative preferences differ across audiences?
- What works best for new customer acquisition vs. retargeting?

## Deliverables
1. **Executive Summary** - Key findings and immediate actions
2. **Performance Comparison** - Side-by-side analysis of top vs. bottom performers
3. **Best Practices Guide** - Creative guidelines based on my data
4. **Improvement Recommendations** - Specific fixes for underperforming ads
5. **Creative Framework** - Template for evaluating future concepts

Include specific examples from my ads with reasoning for each recommendation.
The Meta Creative Strategy Agent can synthesize data to deliver comprehensive reports that highlight key performance metrics, identify trends, and provide actionable recommendations. It is able to transform raw data into clear, actionable reports to guide your advertising strategy, to save hours on manual reporting.
Identify and replicate the strategy of your highest-performing ads with the Meta Creative Strategy Agent.
To get a detailed analysis of video ad performance, you can upload performance metrics downloaded from the ad platform that includes the following data:
When prompting Moby AI, be sure to:
Here is an example of a prompt formatted using Markdown that requests a report on video ad performance:
#Report Title: Best Performing Video Ad Analysis

##Sub-title: Use this analysis to make more winning video ads based on current best performers

##Tertiary-title: Best performing video ads are determined by videos with the lowest drop-off rate in the first 25 seconds.
-You should also provide the data ranges included in this report

#Your Directions
You've been given data and analysis amongst my top video ads.

#Video Performance Metrics Start by providing me with an overview of my video ad performance with the following aggregate metrics

-Average dropoff rate (first 25 seconds)
-Average video views (total video views divided by the number of ads)
-Average video duration
-Total spend on all video ads

Using the video ads with a "dropoff_0s_25" **designation of "low" or "average"**, compile the "video description", "hook description" and "first 25 second description" and summarize the common themes amongst the video ads with a low or average dropoff designation. You should use the video description and the ad copy for this analysis. Make it distinct in your report whether you're describing actions taking place in the video or ad copy.

Provide me with an analysis that describes the common themes from the video description that lead to it being a great video ad. You should bullet list out common themes found in the following parts of the video and any commonalities in the style of the video, actors being used, messaging, psychological principles, voice over, music, etc.

-full video description,
-the "hook" (first three second description),
-the "first 25 seconds" description

#Output Requirements - Build the following sections using the data and insights captured in the previous step

1. Video Performance Metrics
2. Common Success Themes
3. Ads with Low or Average Dropoff Rates

-Display each of the video ads provided in a two-column card view where the **video url is displayed as a square image and is playable upon clicking**. The cards should be displayed side by side, next to eachother as two column and and multiple row matrix with two ads per row. The ad name and ad id should be displayed above the image with the rest of the metrics and descriptions below the video image in bullet format

4. Creative Brief
5. Ads with High Drop Off Rates
-Display each of the video ads provided in a two-column card view where the **video url is displayed as a square image and is playable upon clicking**. The cards should be displayed side by side, next to each other as two column and and multiple row matrix with two ads per row. The ad name and ad id should be displayed above the image with the rest of the metrics and descriptions below the video image in bullet format

Remember that after the qualitative debrief, I want my video image cards displayed as a column x row format (2x) where I have two video image cards per row.
A prompt like this using Moby AI would provide a report that looks like this, and provides clear performance metrics for the video ads, common success themes, and playable files with the video content for easy viewing.
It’s easy to fall off course when you’re operating a fast-paced ecommerce business.
Traditionally, brands would attempt to course correct halfway through the month, when the analyses are finally complete. By the time a brand realizes it’s behind pace to meet month-end goals, it’s too late to adjust advertising spend, inventory decisions, or promotional strategies. There’s a critical need for real-time goal tracking, so you can make informed decisions more quickly.
To build a pacing analysis from the ground up, you need three core data components:
Each component needs to be comprehensive and consistently formatted to enable meaningful analysis.
To run a reliable pacing analysis with an LLM, you first need to collect a complete snapshot of your current performance, historical context, and clearly defined growth targets — all structured in a way that supports accurate comparisons and forecasting.
Essential data to collect:
1. Current performance metrics (month-to-date):
2. Historical comparison data:
3. Clearly defined growth targets:
Once you've gathered the right performance, customer, and marketing data, the next step is organizing it in a way that enables reliable, fast-paced analysis. Here's how to structure your datasets and reporting environment so you can get the most out of LLM-powered insights.
With all of this performance data and goals organized, you can request an analysis from the LLM using a prompt like this:
# Month-to-Date Performance Analysis
I've uploaded MTD performance data, YoY comparisons, and growth targets. Please analyze pacing and provide recommendations:
## Performance Assessment
- Are we on track for monthly and annual revenue targets?
- Which metrics show strongest/weakest performance vs. targets?
- What percentage of monthly targets achieved vs. time elapsed?
## Channel & Category Breakdown
- Which marketing channels exceed/underperform expectations?
- Are product categories significantly ahead or behind target?
- How is customer acquisition pacing vs. annual goals?
- Which channels show best/worst ROI currently?
## Forecasting & Trends
- Based on daily trends, forecast end-of-month performance
- Identify concerning downward trends needing attention
- Highlight metrics with positive momentum to capitalize on
- Compare seasonal patterns to last year
## Strategic Recommendations
- What immediate actions improve underperforming areas?
- Where should we increase/decrease ad spend for monthly targets?
- Which promotional or inventory decisions could close gaps?
- How should we reallocate resources between channels?
## Deliverables
1. **Executive Dashboard** - Green/Yellow/Red pacing status
2. **End-of-Month Forecast** - With confidence intervals
3. **Priority Action Plan** - Ranked by impact potential
4. **Budget Reallocation** - Channel recommendations with spend suggestions
5. **Daily Monitoring Checklist** - For remainder of month
6. **Risk Assessment** - Biggest threats to targets
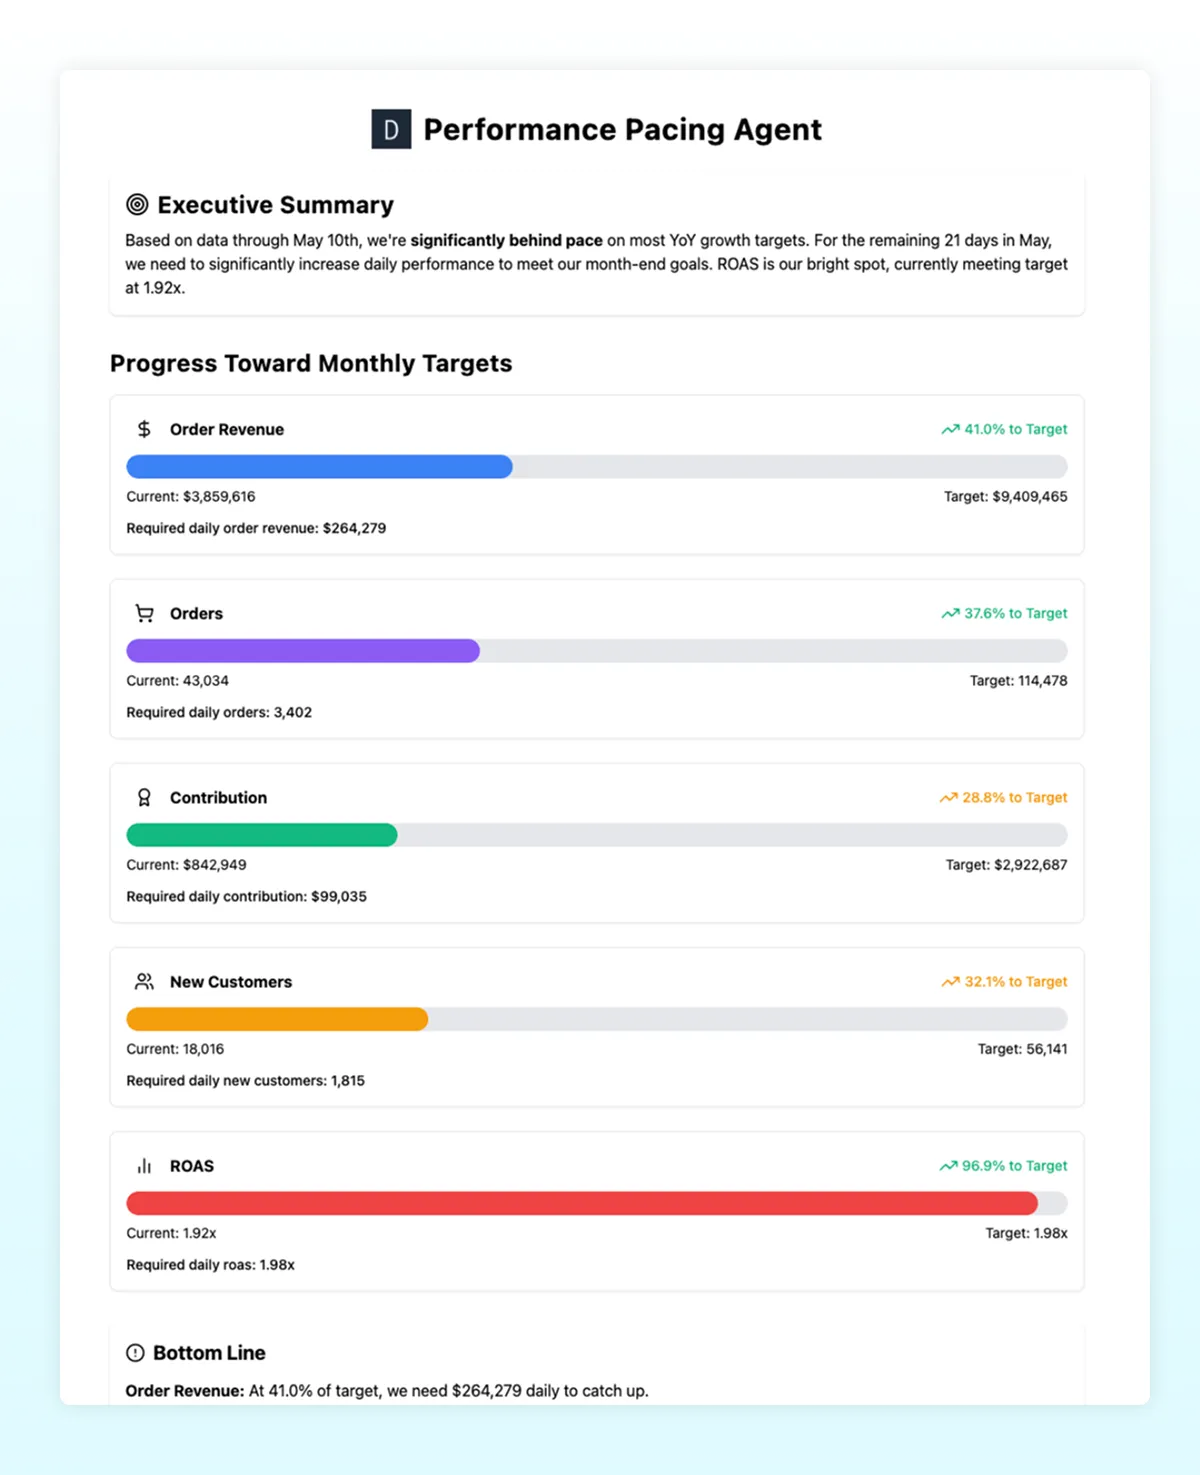
Include specific numbers, percentages, and reasoning for each recommendation.Of course there’s an agent that can do all of this automatically for you, and it’s called the Performance Pacing Agent. It can quickly analyze current month-to-date performance against year-over-year growth targets and provide a comprehensive, data-driven report that empowers you to make informed decisions and optimize strategies for success.
How the Performance Pacing Agent works:
Want to make performance pacing a whole lot easier? Try the Performance Pacing Agent today.
The above examples are only five of more than 100 dedicated agents that have already been developed by the Triple Whale team to specifically tackle the most common ecommerce data analysis requests. And we’re developing new agents every day!
Moby Agents are ready to help you maximize performance at every stage of your business:
Agentic AI is the latest innovation in artificial intelligence. The Ultimate AI Agents Playbook for Ecommerce Brands will make sure you’re up-to-speed with how AI agents can accelerate your growth!
In short, it saves you a ton of time and energy so you can focus on the more important things–like taking action on all of those intelligent insights. But, in more detail:
The Triple Whale Data Platform is an AI-optimized, fully-managed data warehouse that brings all of your data together as a single source of truth. This universal schema allows brands to conduct real-time data processing at scale.
The ability to pull data from any major ad platform, 3PL and logistics applications, or any number of third-party integrations means all of your data is in one place and up-to-date.
No need to download or upload data at any time, it’s all accessible with a simple prompt in Moby AI. An Agent can run from a single natural language prompt, and instantly produce a visual of your request.
Unlike a standard LLM where you’d have to re-download, organize, then upload new data each day for a new analysis, Moby AI already has all of the information ready for the next query.
We already trained Moby AI on millions of ecommerce interactions and provided Moby AI the context to understand the specific needs, lingo, and nuances of ecommerce data. You don’t have to spend time training the model to get the output you want.
If the 99+ pre-built ecommerce intelligence agents don’t deliver your exact need, you can build an agent yourself using natural language prompts–quickly and easily.
Since agents can continuously monitor your performance, they are able to uncover anomalies in spend, performance, and site behavior far quicker than the average human, and can save you money in places you never would have found on your own.
The estimated number of manual hours required for just the five examples above is 34-51 hours per month – essentially a full work week. For a brand running these analyses, that’s 360-540 hours a year. When you consider how manual analysis can lead to delays in decision-making, the impact of lost time is even more clear.
Ready to make confident, data-driven decisions faster than ever before? Sign up for a demo of Moby Agents today.
While LLMs like ChatGPT and Claude can provide valuable insights when prompted correctly, the manual process of data collection, organization, and analysis remains time-intensive. For ecommerce brands that are serious about moving quickly to scale, Moby Agents can remove that complexity entirely to deliver instant, expert-level analysis without hours of manual labor.
Stop drowning in data and start using it intelligently. Get started with Moby Agents today.


Body Copy: The following benchmarks compare advertising metrics from April 1-17 to the previous period. Considering President Trump first unveiled his tariffs on April 2, the timing corresponds with potential changes in advertising behavior among ecommerce brands (though it isn’t necessarily correlated).


.webp)

.webp)


.png)


.jpg)

.png)
