


.png)
Every marketer and business owner eventually lands on the same question: how much does it actually cost to acquire one customer?
That’s what cost per acquisition (CPA) measures. It’s one of the most direct indicators of marketing efficiency, and getting the calculation right is the first step toward understanding whether your campaigns are pulling their weight.
This article walks through the CPA formula step by step. You’ll learn how to calculate CPA, how to interpret the result, and how CPA fits alongside related metrics like CLV, customer acquisition cost (CAC), and return on ad spend (ROAS).
Cost per acquisition is the amount of money you spend to acquire a single new customer or lead through a specific campaign or channel. It’s a campaign-level or channel-level metric, and it’s one of the most commonly tracked key performance indicators (KPIs) in digital marketing performance reporting.
CPA is sometimes confused with CAC, but they’re not the same thing. CPA typically measures the cost of a specific conversion event within a single campaign or acquisition channel. CAC is broader: it accounts for all marketing and sales costs across the entire business over a given period. For a deeper breakdown of how these two metrics differ, check out our guide on the difference between CPA and CAC.
Well, there are two CPA formula variants, and each one has a specific use case. Let’s break them both down.
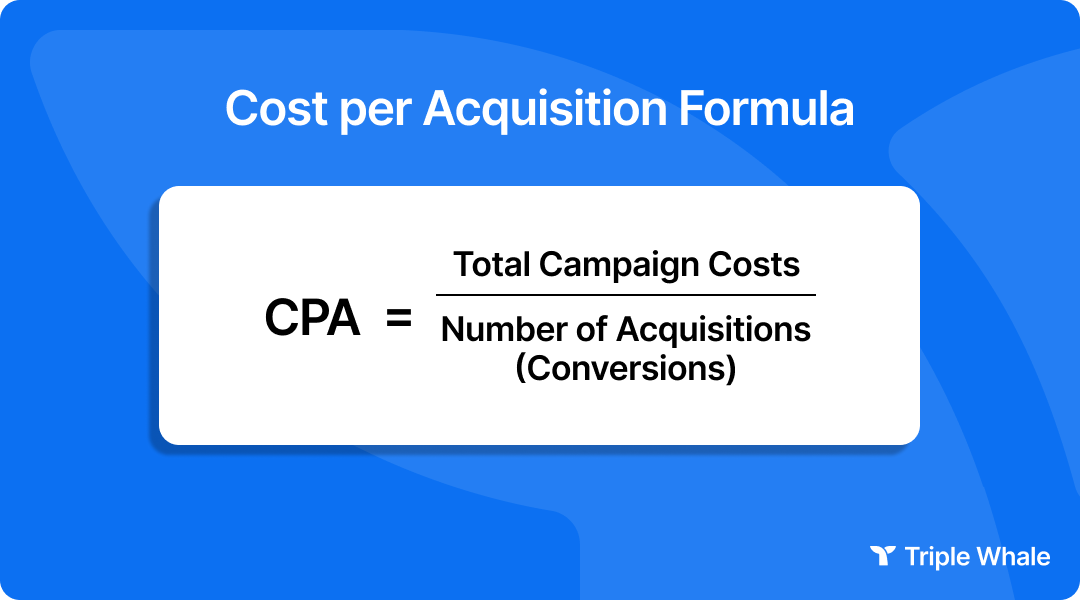
This is the cost per acquisition formula most marketers default to because it gives you a direct, real-world measure of what you paid for each new customer.
What to include in “total campaign cost”:
What to exclude:
Including those inflates your CPA and makes it an unreliable measure of acquisition efficiency.
One more thing: “new customers acquired” should reflect only net-new customers or leads generated during the measurement period. Repeat purchasers or existing contacts re-engaged through the campaign don’t count here.
CPA = Cost Per Click (CPC) ÷ Conversion Rate
This CPA equation is useful when you already have CPC and conversion rate data available from a platform like Google Ads or Meta Ads Manager and want to estimate or project CPA without aggregating total campaign costs from scratch.
Example: If your CPC is $2.50 and your landing page conversion rate is 5%, your CPA = $2.50 ÷ 0.05 = $50.
This formula also makes it easy to model how changes to CPC or conversion rate will affect CPA. If you can improve your conversion rate from 5% to 6% while keeping CPC flat, your CPA drops from $50 to about $41.67. That kind of forecasting is valuable for optimization planning and budget conversations.
The CPA calculation formula is straightforward, but getting an accurate result depends on being rigorous about your inputs. Here’s the process:
Pick the specific campaign (or channel) and the date range you want to evaluate. Whether it’s a 30-day paid social campaign, a quarterly Google Ads push, or a product launch, define the boundaries clearly before you start pulling numbers.
List every cost directly attributable to the campaign. This includes media spend, creative production, agency fees, and any allocated salaries or commissions. Add them up to get your total campaign cost.
Pull the number of net-new customers or qualified leads generated by the campaign during the defined period. Make sure you’re not double-counting existing customers who came back through the campaign.
Divide total campaign cost by new customers acquired. That’s your CPA!
Does the number make sense? Compare it to your previous campaigns, your CLV, and your margin. If the CPA seems unusually high or low, go back and check your cost inputs and conversion count. A mistake in either one throws the whole calculation off.
Let’s walk through a realistic scenario. Say you run a DTC skincare brand and you just wrapped a 30-day paid social campaign on Meta.
During that 30-day window, the campaign generated 230 new customers.
CPA = $11,500 ÷ 230 = $50.00
Now, is a $50 CPA good? It depends on context.
If your average CLV is $180, a $50 CPA means you’re spending about 28% of lifetime value on acquisition (which is within healthy territory). If CLV is only $70, a $50 CPA is eating up more than 70% of customer value, and there’s almost no margin left after fulfillment and product costs. You’d need to either bring CPA down or improve retention to raise CLV.
Knowing how to calculate CPA is only half the job. The other half is knowing what to do with the number once you have it.
A rising CPA means you’re spending more to acquire each customer. The two most common causes:
Diagnosing which cause is driving the increase determines the correct response. A cost problem calls for bid strategy or channel adjustments. A conversion problem calls for creative optimization, audience targeting refinement, or landing page testing.
A falling CPA generally indicates improving efficiency. You’re getting more conversions per dollar spent. This is the expected outcome of optimization efforts like retargeting, creative testing, and audience refinement.
On the other hand, a CPA that falls too low may signal that you’re under-investing in acquisition. You might be reaching only the easiest-to-convert audiences and leaving growth on the table. Efficiency and scale are often in tension.
If CPA is extremely low, it may mean the campaign is only reaching high-intent, bottom-of-funnel audiences who would have converted anyway, not that the marketing is working efficiently at scale.
Sustainable customer acquisition requires investing in audiences beyond the lowest-hanging fruit. That will naturally raise CPA somewhat, but it expands the customer base and supports long-term growth. Think of it as a tradeoff: a slightly higher CPA can be the price of scaling.
CPA in isolation doesn’t tell you whether your acquisition is sustainable. For that, you need to compare it to customer lifetime value.
The rule of thumb: CPA should not exceed one-third of CLV.
If your CLV is $300, a CPA above $100 puts the unit economics of acquisition under pressure. The remaining two-thirds of CLV needs to cover cost of goods, fulfillment, customer service, and still contribute to profit margin. A CPA that eats more than one-third of CLV compresses margins to the point where growth becomes unprofitable.
Worked example: If your brand’s average CLV is $450, the target CPA ceiling is $150. If your current CPA is $180, you’re either over-spending on acquisition or need to improve CLV through retention strategies.
IF you’re not sure how to figure out your customer lifetime value, check out our guide on how to calculate CLV.
Benchmarks vary significantly by industry, channel, and business model. The table below uses Triple Whale’s own aggregated data across thousands of ecommerce brands over the last 365 days, showing median CPA by industry vertical:
Keep in mind that the industry trends are directional reference points rather than targets. The most meaningful benchmark is your company’s own historical CPA trend. If your CPA is dramatically higher than industry norms, that may signal a problem, but optimization decisions should still be based on profitability metrics like LTV and margin, not benchmarks alone.
Return on ad spend (ROAS) measures how much revenue you generate for every dollar of ad spend. While CPA tells you what it cost to acquire a customer, ROAS tells you how much revenue that ad spend returned.
The practical takeaway: use CPA to evaluate acquisition efficiency and ROAS to evaluate revenue return. Tracking both together gives a more complete picture of campaign performance than either metric alone.
CPA is useful, but it’s incomplete. Here’s where the formula can mislead without additional context:
CPA is most useful when tracked as a part of a broader marketing dashboard that includes CLV, ROAS, customer acquisition cost (CAC), and marketing ROI — not as a standalone decision-making metric.
Here are a handful of actionable strategies to bring CPA down while keeping your acquisition engine healthy:
The CPA formula is simple. The challenge is the inputs, the interpretation, and the context. Calculating CPA correctly means being precise about which costs to include, counting only net-new customers, and then using the result as one signal, alongside CLV, ROAS, and CAC, rather than the only signal.
If you’re running paid acquisition at scale, having all of these metrics in a single dashboard with real-time data across every channel is what makes it easier to make decisions quickly and confidently. That’s what Triple Whale is built for.
The standard CPA formula is Total Campaign Cost ÷ Number of New Customers Acquired. There’s also an alternative formula: CPC ÷ Conversion Rate, which is useful when you have platform-level data available.
CPA measures the cost to acquire a customer through a specific campaign or channel. CAC is a broader metric that accounts for all marketing and sales costs across the entire business. CPA is a campaign-level view; CAC is a company-level view.
A rising CPA usually means either your costs increased (CPCs went up, competition increased) or your conversions declined (creative fatigue, audience saturation, landing page issues). Check both sides of the equation to diagnose the cause.
Yes, a very low CPA can indicate that you’re only reaching bottom-of-funnel, high-intent audiences, which are people who would’ve converted regardless. That limits your growth. Sustainable acquisition often means accepting a slightly higher CPA to reach new audiences.
CPA measures the cost to acquire a customer. ROAS measures the revenue returned per dollar of ad spend. They answer different questions and are most useful when tracked together for a complete view of campaign efficiency and revenue performance.
Every marketer and business owner eventually lands on the same question: how much does it actually cost to acquire one customer?
That’s what cost per acquisition (CPA) measures. It’s one of the most direct indicators of marketing efficiency, and getting the calculation right is the first step toward understanding whether your campaigns are pulling their weight.
This article walks through the CPA formula step by step. You’ll learn how to calculate CPA, how to interpret the result, and how CPA fits alongside related metrics like CLV, customer acquisition cost (CAC), and return on ad spend (ROAS).
Cost per acquisition is the amount of money you spend to acquire a single new customer or lead through a specific campaign or channel. It’s a campaign-level or channel-level metric, and it’s one of the most commonly tracked key performance indicators (KPIs) in digital marketing performance reporting.
CPA is sometimes confused with CAC, but they’re not the same thing. CPA typically measures the cost of a specific conversion event within a single campaign or acquisition channel. CAC is broader: it accounts for all marketing and sales costs across the entire business over a given period. For a deeper breakdown of how these two metrics differ, check out our guide on the difference between CPA and CAC.
Well, there are two CPA formula variants, and each one has a specific use case. Let’s break them both down.
This is the cost per acquisition formula most marketers default to because it gives you a direct, real-world measure of what you paid for each new customer.
What to include in “total campaign cost”:
What to exclude:
Including those inflates your CPA and makes it an unreliable measure of acquisition efficiency.
One more thing: “new customers acquired” should reflect only net-new customers or leads generated during the measurement period. Repeat purchasers or existing contacts re-engaged through the campaign don’t count here.
CPA = Cost Per Click (CPC) ÷ Conversion Rate
This CPA equation is useful when you already have CPC and conversion rate data available from a platform like Google Ads or Meta Ads Manager and want to estimate or project CPA without aggregating total campaign costs from scratch.
Example: If your CPC is $2.50 and your landing page conversion rate is 5%, your CPA = $2.50 ÷ 0.05 = $50.
This formula also makes it easy to model how changes to CPC or conversion rate will affect CPA. If you can improve your conversion rate from 5% to 6% while keeping CPC flat, your CPA drops from $50 to about $41.67. That kind of forecasting is valuable for optimization planning and budget conversations.
The CPA calculation formula is straightforward, but getting an accurate result depends on being rigorous about your inputs. Here’s the process:
Pick the specific campaign (or channel) and the date range you want to evaluate. Whether it’s a 30-day paid social campaign, a quarterly Google Ads push, or a product launch, define the boundaries clearly before you start pulling numbers.
List every cost directly attributable to the campaign. This includes media spend, creative production, agency fees, and any allocated salaries or commissions. Add them up to get your total campaign cost.
Pull the number of net-new customers or qualified leads generated by the campaign during the defined period. Make sure you’re not double-counting existing customers who came back through the campaign.
Divide total campaign cost by new customers acquired. That’s your CPA!
Does the number make sense? Compare it to your previous campaigns, your CLV, and your margin. If the CPA seems unusually high or low, go back and check your cost inputs and conversion count. A mistake in either one throws the whole calculation off.
Let’s walk through a realistic scenario. Say you run a DTC skincare brand and you just wrapped a 30-day paid social campaign on Meta.
During that 30-day window, the campaign generated 230 new customers.
CPA = $11,500 ÷ 230 = $50.00
Now, is a $50 CPA good? It depends on context.
If your average CLV is $180, a $50 CPA means you’re spending about 28% of lifetime value on acquisition (which is within healthy territory). If CLV is only $70, a $50 CPA is eating up more than 70% of customer value, and there’s almost no margin left after fulfillment and product costs. You’d need to either bring CPA down or improve retention to raise CLV.
Knowing how to calculate CPA is only half the job. The other half is knowing what to do with the number once you have it.
A rising CPA means you’re spending more to acquire each customer. The two most common causes:
Diagnosing which cause is driving the increase determines the correct response. A cost problem calls for bid strategy or channel adjustments. A conversion problem calls for creative optimization, audience targeting refinement, or landing page testing.
A falling CPA generally indicates improving efficiency. You’re getting more conversions per dollar spent. This is the expected outcome of optimization efforts like retargeting, creative testing, and audience refinement.
On the other hand, a CPA that falls too low may signal that you’re under-investing in acquisition. You might be reaching only the easiest-to-convert audiences and leaving growth on the table. Efficiency and scale are often in tension.
If CPA is extremely low, it may mean the campaign is only reaching high-intent, bottom-of-funnel audiences who would have converted anyway, not that the marketing is working efficiently at scale.
Sustainable customer acquisition requires investing in audiences beyond the lowest-hanging fruit. That will naturally raise CPA somewhat, but it expands the customer base and supports long-term growth. Think of it as a tradeoff: a slightly higher CPA can be the price of scaling.
CPA in isolation doesn’t tell you whether your acquisition is sustainable. For that, you need to compare it to customer lifetime value.
The rule of thumb: CPA should not exceed one-third of CLV.
If your CLV is $300, a CPA above $100 puts the unit economics of acquisition under pressure. The remaining two-thirds of CLV needs to cover cost of goods, fulfillment, customer service, and still contribute to profit margin. A CPA that eats more than one-third of CLV compresses margins to the point where growth becomes unprofitable.
Worked example: If your brand’s average CLV is $450, the target CPA ceiling is $150. If your current CPA is $180, you’re either over-spending on acquisition or need to improve CLV through retention strategies.
IF you’re not sure how to figure out your customer lifetime value, check out our guide on how to calculate CLV.
Benchmarks vary significantly by industry, channel, and business model. The table below uses Triple Whale’s own aggregated data across thousands of ecommerce brands over the last 365 days, showing median CPA by industry vertical:
Keep in mind that the industry trends are directional reference points rather than targets. The most meaningful benchmark is your company’s own historical CPA trend. If your CPA is dramatically higher than industry norms, that may signal a problem, but optimization decisions should still be based on profitability metrics like LTV and margin, not benchmarks alone.
Return on ad spend (ROAS) measures how much revenue you generate for every dollar of ad spend. While CPA tells you what it cost to acquire a customer, ROAS tells you how much revenue that ad spend returned.
The practical takeaway: use CPA to evaluate acquisition efficiency and ROAS to evaluate revenue return. Tracking both together gives a more complete picture of campaign performance than either metric alone.
CPA is useful, but it’s incomplete. Here’s where the formula can mislead without additional context:
CPA is most useful when tracked as a part of a broader marketing dashboard that includes CLV, ROAS, customer acquisition cost (CAC), and marketing ROI — not as a standalone decision-making metric.
Here are a handful of actionable strategies to bring CPA down while keeping your acquisition engine healthy:
The CPA formula is simple. The challenge is the inputs, the interpretation, and the context. Calculating CPA correctly means being precise about which costs to include, counting only net-new customers, and then using the result as one signal, alongside CLV, ROAS, and CAC, rather than the only signal.
If you’re running paid acquisition at scale, having all of these metrics in a single dashboard with real-time data across every channel is what makes it easier to make decisions quickly and confidently. That’s what Triple Whale is built for.
The standard CPA formula is Total Campaign Cost ÷ Number of New Customers Acquired. There’s also an alternative formula: CPC ÷ Conversion Rate, which is useful when you have platform-level data available.
CPA measures the cost to acquire a customer through a specific campaign or channel. CAC is a broader metric that accounts for all marketing and sales costs across the entire business. CPA is a campaign-level view; CAC is a company-level view.
A rising CPA usually means either your costs increased (CPCs went up, competition increased) or your conversions declined (creative fatigue, audience saturation, landing page issues). Check both sides of the equation to diagnose the cause.
Yes, a very low CPA can indicate that you’re only reaching bottom-of-funnel, high-intent audiences, which are people who would’ve converted regardless. That limits your growth. Sustainable acquisition often means accepting a slightly higher CPA to reach new audiences.
CPA measures the cost to acquire a customer. ROAS measures the revenue returned per dollar of ad spend. They answer different questions and are most useful when tracked together for a complete view of campaign efficiency and revenue performance.

Calculate cost per acquisition the right way with both CPA formula variants, step-by-step calculation examples, and guidance for interpreting your results.
Body Copy: The following benchmarks compare advertising metrics from April 1-17 to the previous period. Considering President Trump first unveiled his tariffs on April 2, the timing corresponds with potential changes in advertising behavior among ecommerce brands (though it isn’t necessarily correlated).


.webp)

.webp)


.png)


.png)
.png)
.png)