Knowing your return on advertising spend (ROAS) helps you run a successful business. Your ROAS is the revenue you generate from advertising compared with what you spent on it. So, in general, you want this number to be high, because that means your ads are effective.
But that doesn’t mean there’s a one-size-fits-all approach. In this article, you’ll find ROAS benchmarks and tips on how to evaluate ad spend, so you can decide what a good ROAS number looks like for your industry. Plus, we’ve got insider strategies on how to improve your score.
Key takeaways
- ROAS, or return on ad spend, tells you how much revenue your ads bring back for every dollar you spend.
- The median ROAS across Triple Whale brands was 3.18 on Google Ads, 1.88 on Meta Ads, and 1.47 on TikTok Ads.
- A high ROAS can still lose money. Say a $100 order costs you $80 in product, shipping, and fees, and you spend $25 on ads to win it. That’s a 4x ROAS, but you lose $5 on the sale.
What is ROAS?
First, a quick refresher: ROAS is a simple calculation that shows how much you earn for every dollar you spend on advertising. This gives you a quick read on whether your advertising strategy works or needs changes. By measuring ROAS, you can decide how to allocate ad spend and improve campaign performance.
So, what is a good ROAS? Many marketers say 2 to 4 is good and 5 or more is great.
A ROAS of 2 or lower is usually too low. At 1, you only earn back what you spend on ads, and you still have to pay for your products, shipping, and fees.
But those ranges are only a starting point. The number that matters most is the break-even ROAS that still covers your costs. A 5 can lose money for a brand with thin margins, while a 2 can make money for a brand with high margins. Later in this article, you’ll learn how to find your number.
How to calculate ROAS
Here’s how to calculate ROAS: Divide the revenue from your ads by your total ad spend.
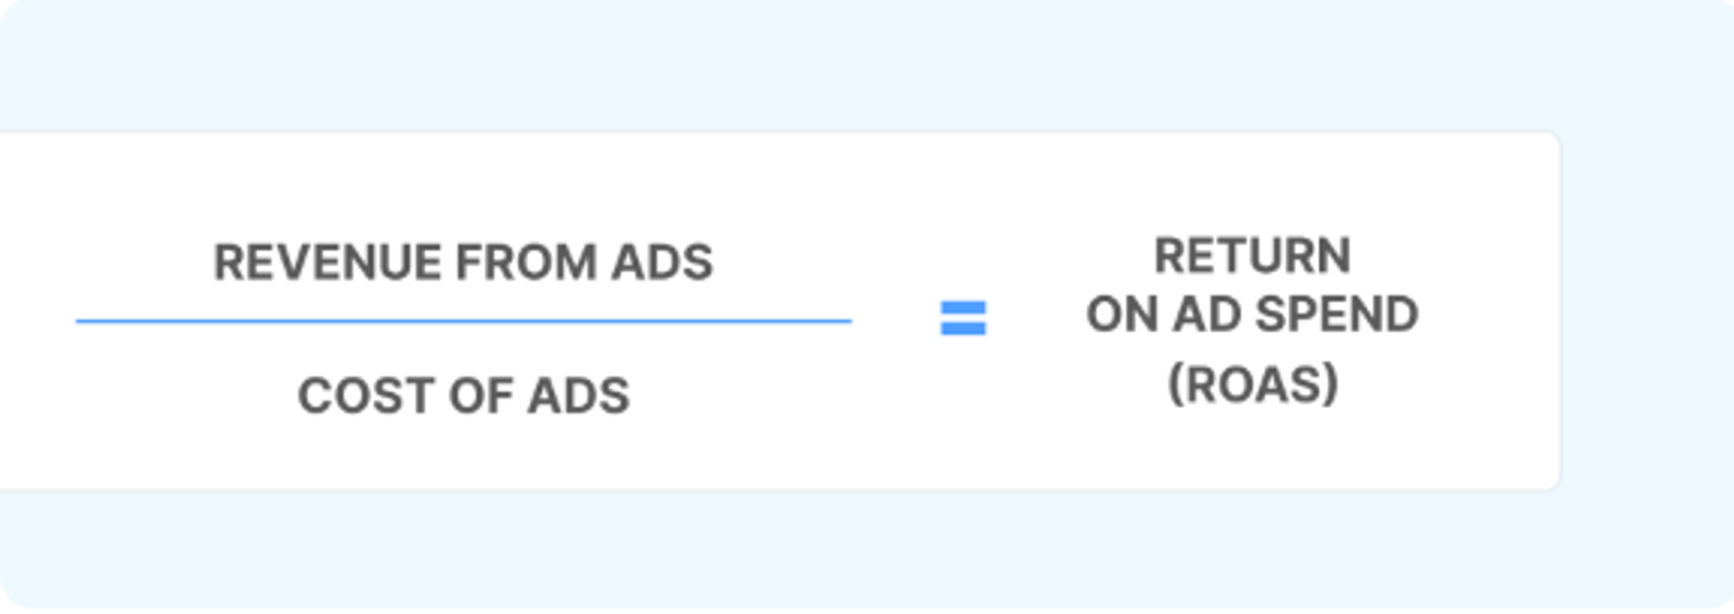
ROAS = Revenue from Ads ÷ Cost of Ads
ROAS example
For example, if your Facebook advertising campaign generates $10,000 in revenue and the total cost of the campaign is $2,000, the ROAS would be 5.
ROAS = $10,000 ÷ $2,000 = 5
You may see these numbers written as a number, such as 5 or 5x, or as a ratio like 5:1. Both mean the same thing: you earn $5 in revenue for every $1 you spend on ads.
Calculate the ROAS your business needs
To calculate the ROAS your business needs, most businesses start with the breakeven ROAS. Your breakeven ROAS is the lowest ROAS that still covers your costs. At breakeven, you didn’t lose money on the sale, but you didn’t make a profit either.
To find it, start with your contribution margin before ad spend. That’s the revenue left from each sale after the variable costs you choose to include, other than ads. These costs can include product costs, packing, shipping, and payment fees.
How to calculate breakeven ROAS
The breakeven ROAS formula is 1 divided by your margin rate. The answer tells you when an order pays for its own costs and its ads. It doesn’t tell you when your whole company breaks even, because your company also pays fixed costs like salaries and rent.
Breakeven ROAS = 1 ÷ Margin before ads
Breakeven ROAS example
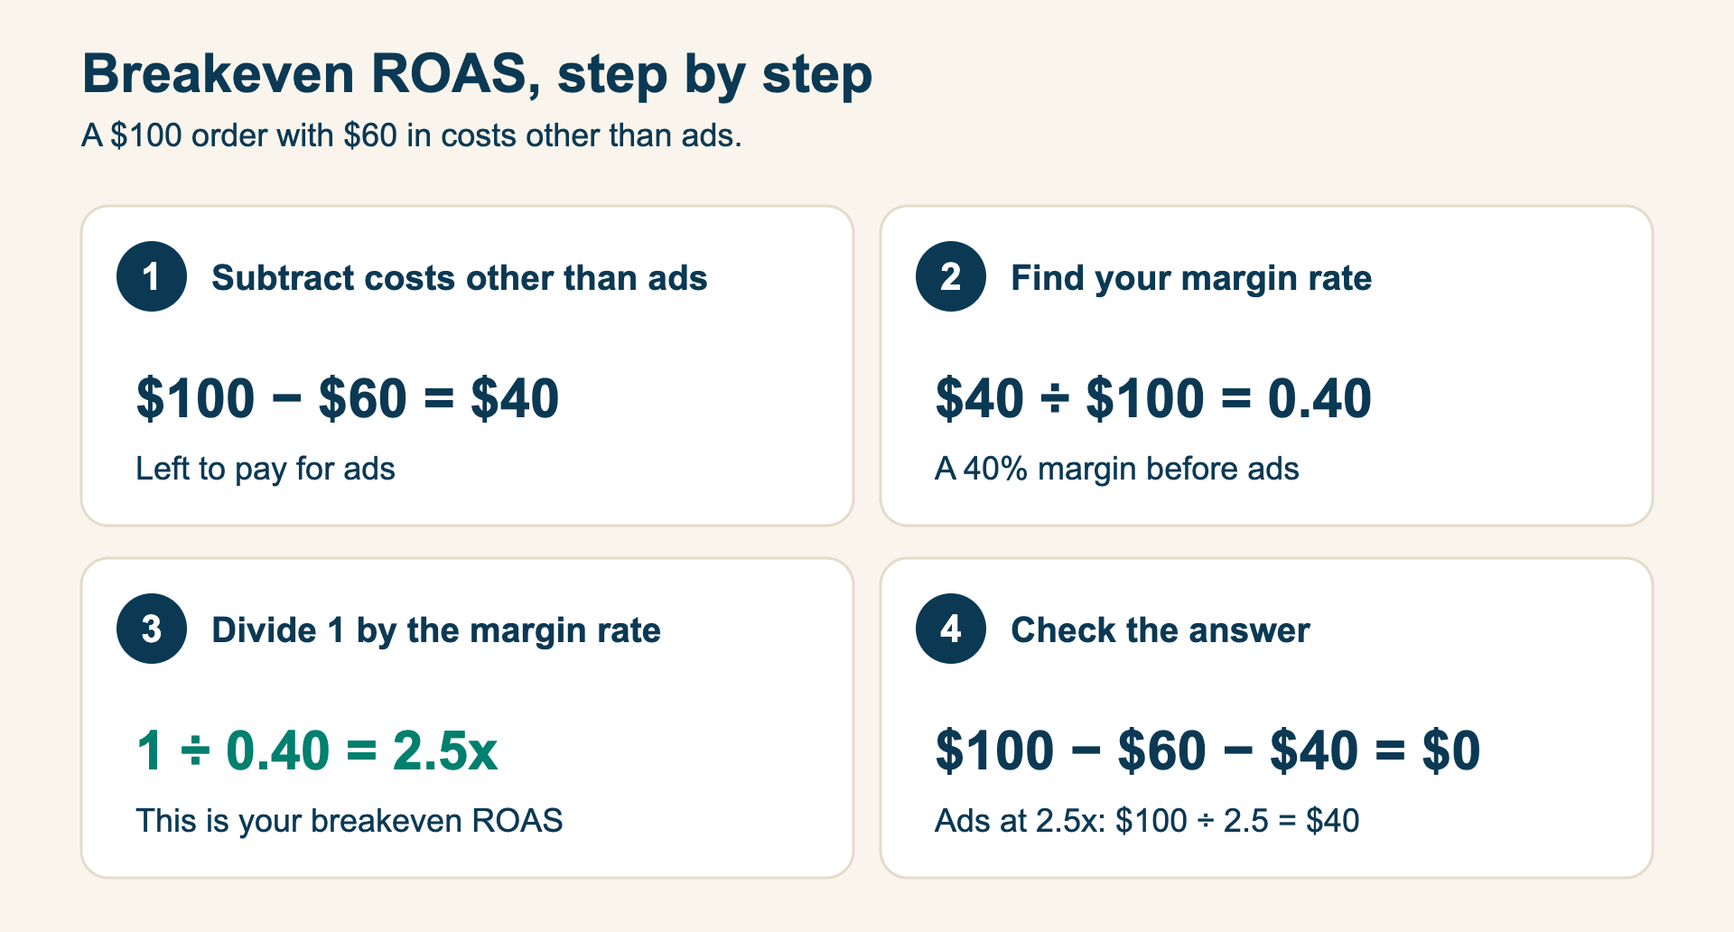
Say a customer placed a $100 order. Variable costs other than ads total $60. Here's how that breaks down:
Step 1: Find what’s left after costs other than ads
$100 order - $60 variable costs = $40 left to pay for ads
Step 2: Turn that into a margin rate
$40 ÷ $100 = 0.40, or a 40% margin before ads
Step 3: Divide 1 by the margin rate
Breakeven ROAS = 1 ÷ 0.40 = 2.5
Step 4: Check the answer.
Ad spend at 2.5x = $100 ÷ 2.5 = $40
$100 − $60 costs − $40 ads = $0 left
At 2.5x, the order covers both its costs and its ads. You didn’t lose money, and you didn’t make a profit.
Set a target above breakeven ROAS
Obviously, you’ll want to make a profit. So you can use breakeven ROAS as your baseline. Then, set a target above that.
To find a target, start with the share of each sale you keep before ads. Subtract the share you want to keep after the ads. Then divide 1 by the result.
Target ROAS = 1 ÷ (Margin before ads − Margin you want after ads)
Say you keep 40% of each sale before ads, and you want to keep 10% after ads. That leaves 30% to spend on ads. Divide 1 by 0.30, and your target ROAS is 3.33x. If you want to keep as much of your margin before ads (or more), no ROAS can get you there.
Treat the 3.33x as a starting point. Overhead and taxes will shrink your real profit, returns will lower your revenue, and a slow payback can strain your cash if your ad spend takes months to come back.
ROAS benchmarks by industry
Benchmarking against industry standards and competitors can help you see what a good ROAS is for your industry. By comparing your ROAS with similar businesses, you can find areas to improve and adjust your campaigns. Compare like with like: use the same channel, attribution model, and time period.
From October 1, 2025, to September 30, 2026, the median ROAS for brands advertising on Triple Whale was 2.22.
Many brands experience higher or lower ratios depending on their industry, ad channel, and other factors.
The table below shows median ROAS by industry for Google Ads, Meta Ads, and TikTok Ads, using Triple Whale’s proprietary data.
| Industry | Median Google Ads ROAS | Median Meta Ads ROAS | Median TikTok Ads ROAS |
|---|---|---|---|
| Apparel and accessories | 3.88 | 2.26 | 2.75 |
| Health and beauty | 2.76 | 1.54 | 0.38 |
| Home and garden | 3.37 | 2.28 | 2.00 |
| Food and beverage | 3.08 | 1.61 | 0.22 |
| Sports and outdoors | 4.24 | 2.37 | 1.46 |
| Health and wellness | 2.03 | 1.44 | 0.34 |
| Consumer electronics | 2.86 | 1.97 | 1.96 |
| Toys, art, and collectibles | 3.18 | 1.98 | 1.60 |
| Automotive | 3.98 | 2.75 | 1.66 |
| Baby | 3.55 | 2.27 | 2.01 |
| Lifestyle and boutique | 3.07 | 2.06 | 2.05 |
What’s a good ROAS by ad channel?
Above, you can see that the median Google ROAS is higher than the median Meta ROAS across every industry. You’ll need to tweak your definition of a healthy ROAS based on the channel you’re analyzing.
| Ad channel | Median ROAS, current 12 months | Median ROAS, prior 12 months | Change |
|---|---|---|---|
| Google Ads | 3.18 | 3.39 | -6.32% |
| Meta Ads | 1.88 | 1.86 | +1.31% |
| TikTok Ads | 1.47 | 1.49 | -1.69% |
| Amazon Ads | 3.04 | 3.00 | +1.29% |
| Pinterest Ads | 2.06 | 2.47 | -16.72% |
| Snapchat Ads | 4.06 | 3.66 | +10.71% |
| Bing Ads | 2.20 | 2.28 | -3.44% |
Google Ads’ median ROAS fell about 6% from the year before, while Meta, TikTok, and Amazon each moved less than 2%. ROAS tracked from an ad platform and ROAS tracked on your own can differ. Before you compare channels, match the attribution window, the customer mix, and the data source.
What is a good ROAS for Google Ads?
Google says the average ROAS for Google Ads is 2:1, according to the company’s Economic Impact report. That means advertisers earn about $2 in revenue for every $1 they spend. If your ROAS is higher than 2, you’re beating Google’s average.
But beating the average doesn’t mean you're profitable. Compare your ROAS with your breakeven ROAS to see if your ads pay off.
In Google Ads, you can also set a target ROAS using an Automated Smart Bidding strategy that optimizes your ad spend for your specific ROAS goal.
What is a good ROAS for Facebook Ads?
Meta doesn’t say what a good ROAS is. Its Help Center treats a ROAS of 1 as the point where your ad revenue equals your ad spend. That isn’t the same as your breakeven ROAS because you still pay for products, shipping, and fees. Use your own breakeven ROAS as your starting point.
Your results will also depend on who sees the ad. Ads shown to new customers can return less than ads shown to people who already know your brand. Click and view attribution windows also change the number. Compare your ROAS only with results that use the same window and customer mix.
What is a good ROAS on Amazon?
Amazon’s ROAS guide points to an average of about 2:1 and a “good” ROAS of 3 to 4. But treat that as a guide. Amazon fees and other costs still count when you set your target.
Important factors for determining a ‘good’ ROAS
With those benchmarks in mind, you can work with your team to determine your own goal, based on the factors that affect your success, such as:
Industry
As the table above shows, average ROAS varies by industry. On Google Ads, sports and outdoors brands had a median ROAS of 4.24. Health and wellness brands averaged 2.03, less than half that amount. On Meta Ads, the range runs from 2.75 for automotive to 1.44 for health and wellness. So a ROAS that looks weak in one industry can be normal in another.
Channel
Similarly, you can see that average Google ROAS is higher in many industries than average Facebook ROAS. You’ll need to tweak your definition of a healthy ROAS based on the channel you’re analyzing.
Business model
Your business objectives shape what counts as a good ROAS. For example, if your primary goal is brand awareness, you may be comfortable with a lower ROAS if the campaign reaches a wide audience. On the other hand, if your primary goal is to generate revenue, you'll likely need a higher ROAS to achieve it.
Target audience
You have to consider your target audience when you’re determining a good ROAS. If your audience is small, for example, your campaign may not generate as much revenue, which can lower ROAS.
Profit margin
Just like the size of your audience matters, so does your profit margin. If yours is on the smaller side, you’ll need a higher ROAS to turn a profit on your ad spend. Higher profit margins give you some wiggle room to still make a profit with a lower ROAS.
Market competition
Competition in a particular market can also affect ROAS. If many other businesses advertise in the same market, it may be harder to generate revenue from your campaigns, which can lower ROAS. Ask what is good ROAS in a highly competitive market, and you may get a different answer than in a less competitive one.
Economic conditions
Recessions and booms can affect your ROAS. During a recession, consumers may be more hesitant to spend, which can lower ROAS. During a boom, consumers may be more willing to spend, which can lead to higher ROAS.
Context
Traditional ROAS metrics can sometimes be misleading. They only account for the revenue generated by ad campaigns, not the overall impact of those campaigns on your business's bottom line. For example, a campaign that generates a high ROAS may still be costing you money if it isn’t driving repeat business or increasing customer lifetime value.
That’s why at Triple Whale we believe you should consider your ROAS alongside other key metrics, like AOV (average order value) and CAC (customer acquisition cost), as well as ROI. Comparing ROI vs. ROAS gives you a slightly different output because ROI, or return on investment, is your total profit from all your business investments, not just ad spend.
How to improve ROAS without losing sight of profit
Once you’ve used the factors above to find a strong ROAS, you might see it’s time to optimize. Start by finding the problem. Check your tracking, your creative, what it costs to win a customer, and how well your site converts. There are many ways to improve ROAS, and many are simply good business strategies, like improving customer retention and A/B testing your creative.
Look up-funnel for ways to raise your ROAS. Start with your average position and impression share, which you can improve with bidding strategies and feed optimizations. Next, check click-through rate (CTR) and cost per click (CPC) to see how interested searchers are in your product. Once you win the impressions and clicks, your on-site strategy has to close the sale.
Here are a few other suggestions that can help improve your ROAS.
Experiment with different strategies and channels
Small tests show you what works before you commit real budget. Change one thing at a time, such as the audience, the offer, or the ad format, and give each test enough time to gather results. A channel that misses your breakeven isn’t always a bad channel, so see if the number moves before you cut the budget. Keep notes on every test so you can repeat what wins.
Analyze data
Your data shows which campaigns earn their budget and which ones look busy. Compare each campaign’s ROAS with your breakeven ROAS, so a 3x campaign on a thin margin doesn’t fool you. Then look at new customers and returning customers apart, because ads that win first orders can show a lower ROAS but still build repeat sales. Use the same attribution window each time so your numbers stay comparable.
Use AI
Artificial intelligence can read more data than a person can. It can scan your campaigns every day, flag a sudden drop in ROAS, and point to where your budget could work harder. You still make the call, but you spend less time digging through reports and more time acting on what you find.
Test and refresh your creative
Shoppers get tired of seeing the same ad, and your ROAS often slips when they do. Test new images, videos, and hooks, which are the first few seconds or lines that grab attention. When a winning ad starts to fade, make a fresh version in the same style instead of starting from zero. Give each new ad a week or two before you call a winner.
Improve your site and AOV
Your ads can only earn what your site converts. If shoppers click and leave, a faster page, clearer product photos, and an easier checkout can raise your ROAS without any extra ad spend. You can also raise AOV with bundles, free shipping thresholds, or add-on offers. A bigger order means each ad dollar brings back more revenue.
Conclusion
Setting a good ROAS depends on your margins, channels, and goals. But once you know your break-even and aim above it, ROAS gives you a clear way to see if your ad spend is paying off. Benchmarks show where your peers land, and your costs show where you need to be.
A strong ROAS target starts with good data. Track, measure, and improve your ad performance in real time with Triple Whale, and see where every ad dollar goes. Book a demo today or get started with a free account.
What’s a good ROAS? FAQs
Is a 4 ROAS good?
It can be. A 4x ROAS means ads cost 25% of your revenue. If you keep 40% of each sale before ads, you keep 15% after ads and before overhead. If you keep only 20%, a 4x ROAS loses money because you need 5x to break even.
Is a 5 ROAS good?
It depends on your margin. At 5x, ads cost 20% of your revenue. With a 60% margin before ads, you keep 40% before overhead. With a 20% margin, you only break even.
What is a good ROAS percentage?
ROAS as a percentage is the ratio times 100, so 4x is 400%. A bigger percentage still doesn’t tell you your profit. It shows revenue per ad dollar, so compare it with your breakeven ROAS in the same form. For example, a 2.5x breakeven is 250%.
What is a good target ROAS?
A good target ROAS sits above your breakeven ROAS, so every sale leaves you some profit. There’s no single number that fits every brand, because your margin sets it. To find yours, take the share of each sale you keep before ads and subtract the share you want to keep after ads. Then divide 1 by the result. If you keep 30% before ads and you want to keep 5% after, your target is 1 ÷ 0.25, or 4x.
How do you calculate breakeven ROAS?
The break even ROAS formula is 1 divided by your margin before ad spend. That margin is the share of each sale left after costs other than ads, such as product, packing, shipping, and fees. Say you keep 25% of each sale before ads. Divide 1 by 0.25, and your breakeven ROAS is 4x. Below 4x, each sale loses money once you factor in ad costs.