


You got the sale — nice!
It’s the moment every business works toward. But rather than treating this as the finish line, you can capitalize on this moment using post-purchase surveys. They’re excited and invested, making them more willing to share honest feedback.
Post-purchase surveys are questionnaires brands send to customers right after they’ve bought something from their online store. These short, targeted actions are designed to gather valuable feedback.
These surveys are especially helpful for eCommerce brands and subscription-based businesses that want to understand their customers better and see how they can improve the shopping experience, customer service, and product improvements.
They are also extremely helpful for service-based businesses, such as SaaS platforms or agencies, that want to optimize customer acquisition, improve retention, and refine their post-purchase experience.
Zero-party data is data that your customer is directly providing you. It could come from post-purchase survey data, but is also typically from email/sms capture, preference pages as users share their preferences, interests, and needs with a brand.
Post-purchase surveys are arguably the most effective way to collect zero-party data. Below are some of the many benefits to using PPS for zero-party data.
By understanding and addressing customer experience through post-purchase surveys, you can strengthen customer relationships and drive long-term success for your business.
Because this data is shared with consent, you get targeted personalization opportunities (e.g., location, age, interests, hobbies, preferred language) that you can use to tailor experiences, power precise segmentation, make smarter recommendations, and create more relevant campaigns.
Post-purchase surveys can uncover product-specific insights that internal teams might miss.
For example, you might learn that customers appreciate certain product features but find the instructions unclear, or that they struggled to locate key information on your site. These details are invaluable for refining your product design, packaging, or overall user experience.
When you ask targeted questions about product satisfaction, quality, or usability, you can identify potential issues before they lead to returns or support tickets.
Even better – you can address those concerns proactively by updating product descriptions, FAQs, or troubleshooting materials.
These questionnaires show customers that their opinions matter, solidifying why they feel good about their post-purchase decision. When you act on their input with updates or product improvements, you build trust and connection.
Following up with satisfied customers can also spark loyalty, referrals, and repeat purchases.
Below are some of the best post-purchase survey questions to ask, tailored to your specific business goals and the stage of the customer journey you want to better understand.
Conversion rate optimization (CRO) insights reveal exactly where customer engagement might be dropping off or what convinces them to stay. When aggregated, they can inform site optimizations, product page improvements, and better messaging that directly impact conversion rates.
Use personalization questions to better understand your target demographic. By learning about their interests, habits, and preferences, you can create more relevant product recommendations, refine your messaging, and deliver experiences that feel genuinely individualized.
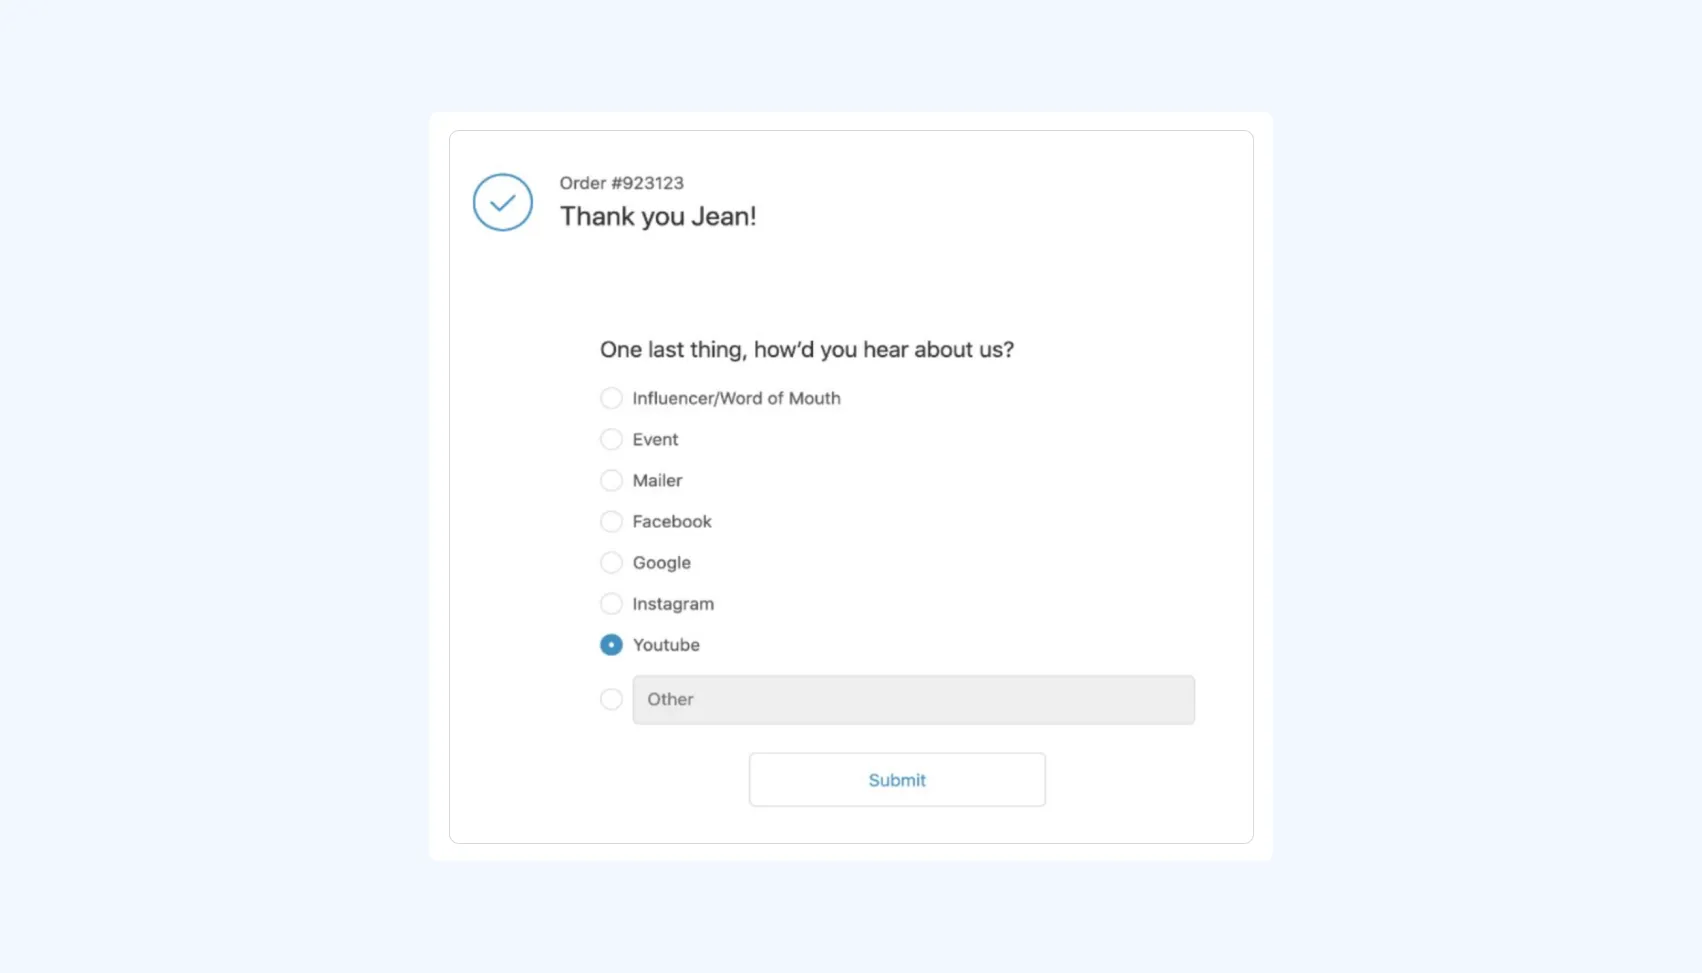
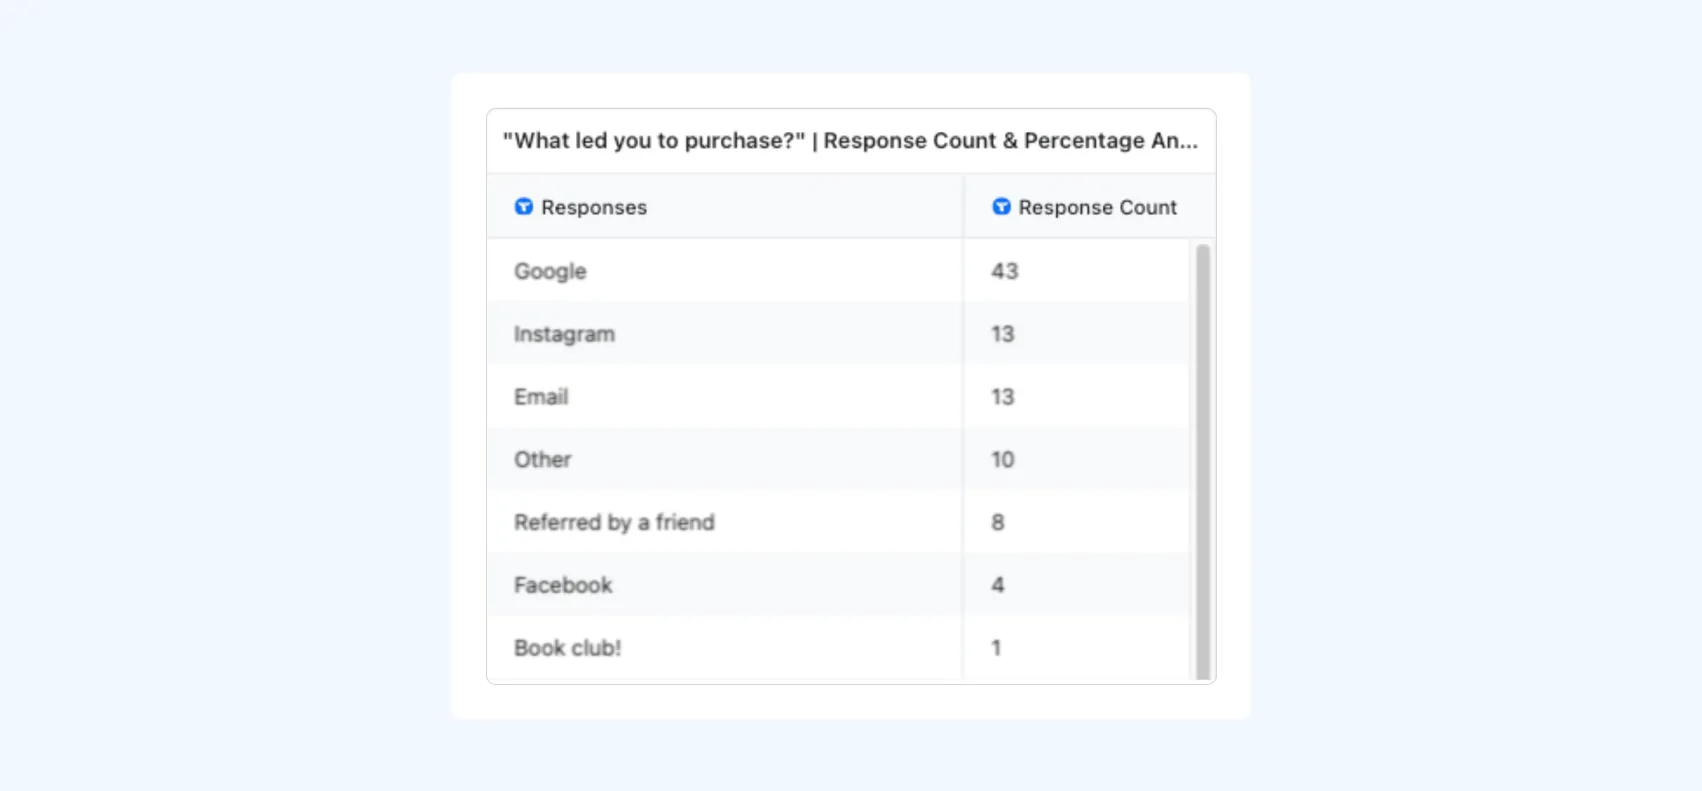
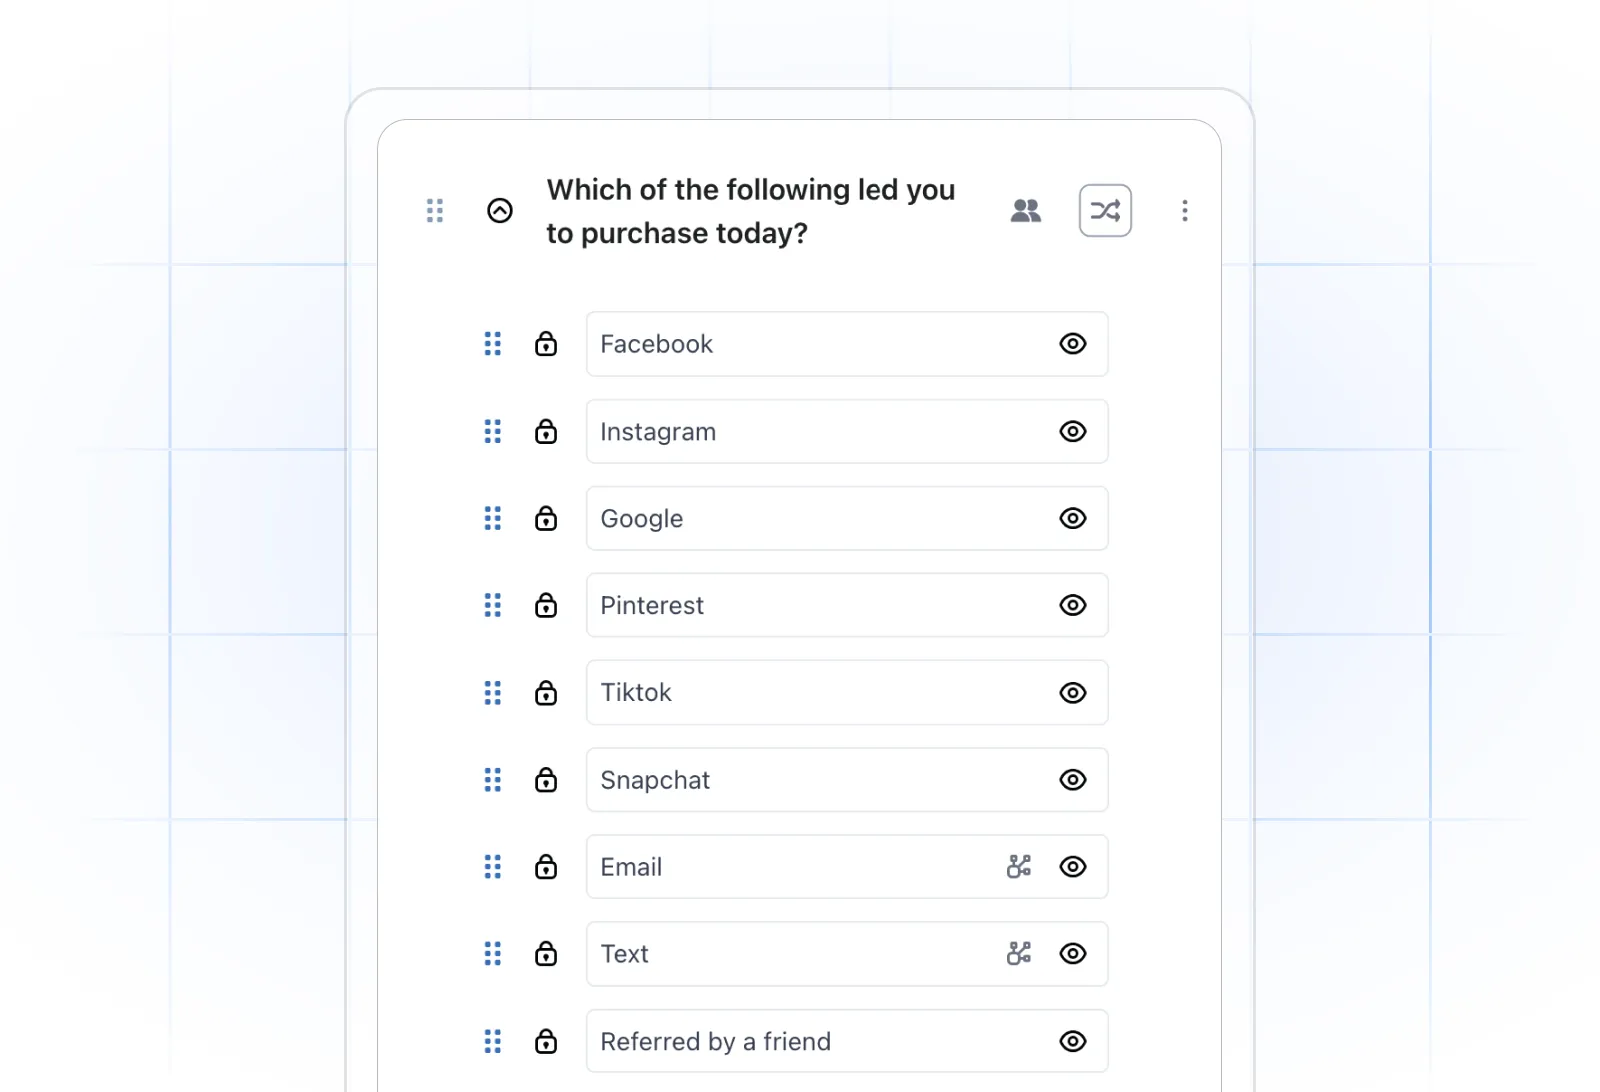
Pinpoint marketing attribution and learn about all the channels driving customers to your shop using attribution questions. Here are some questions to help you go beyond the “how did you hear about us?” template (although the classic question still works!).
By learning how customers use, perceive, and evaluate your product, you can identify opportunities for improvement, innovation, or even new product development. Here are some survey questions to ask about a product.
When aggregated, these questions can inform UX improvements, post-purchase communication strategies, and operational changes that strengthen overall satisfaction and retention.
Pricing plays a huge role in shaping customer perception and purchase decisions. These questions help you understand how customers view your pricing, helping you calculate competitive pricing strategies, opportunities, and promotions.
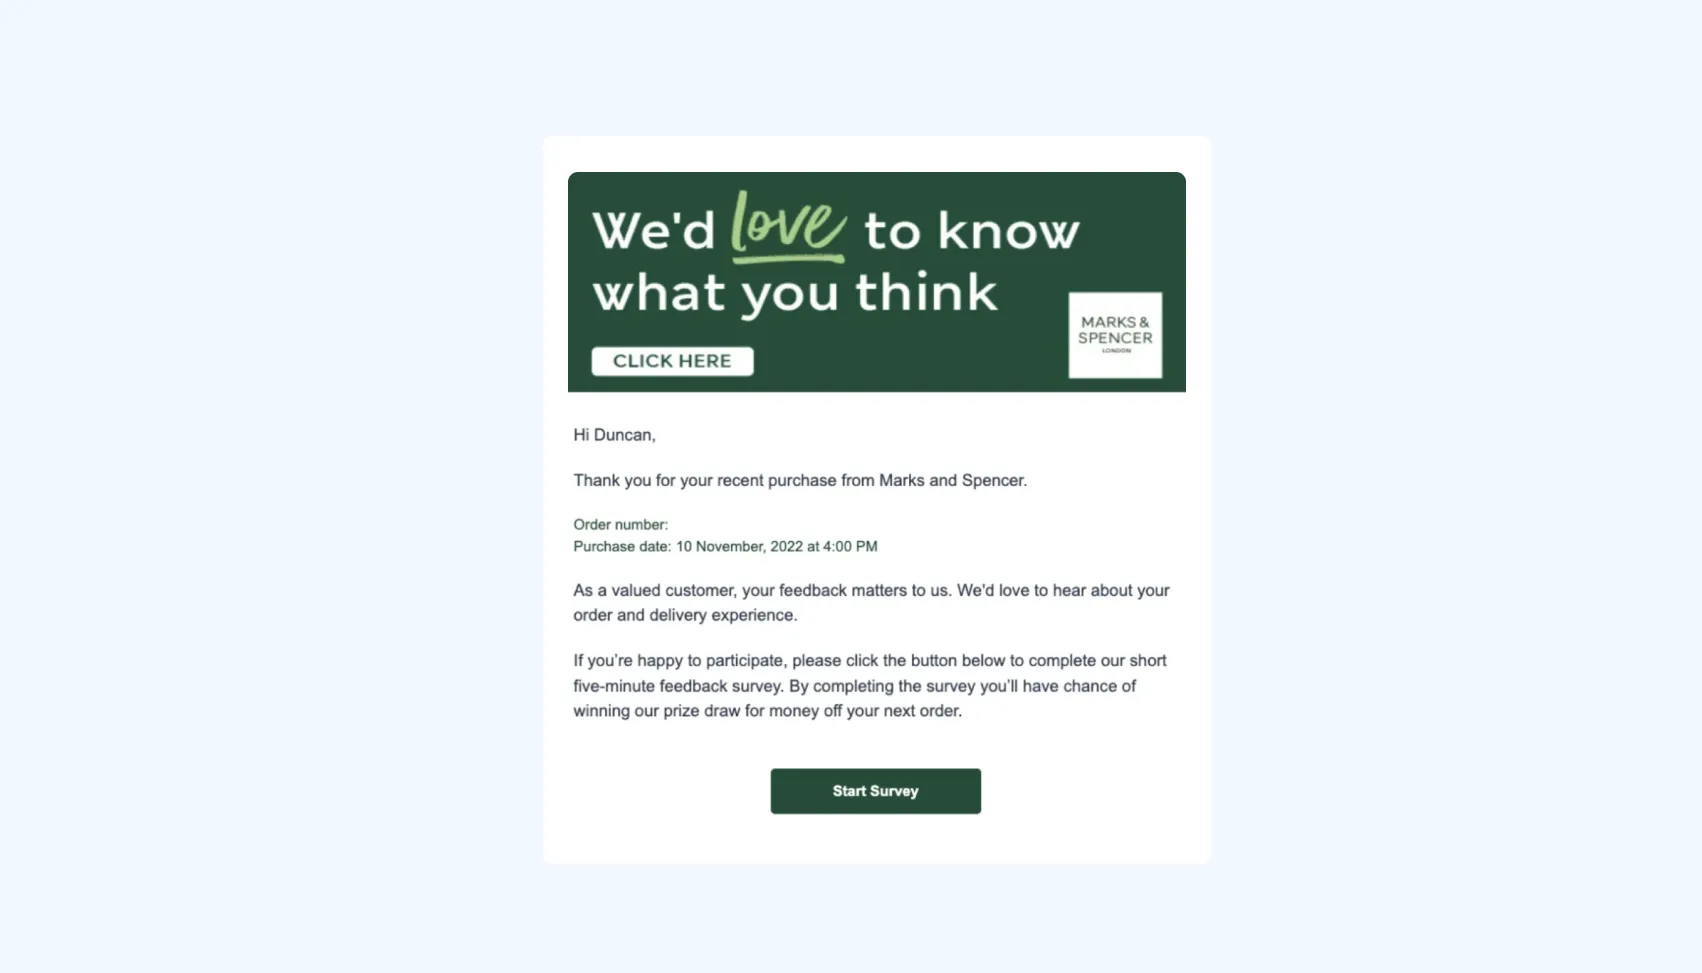
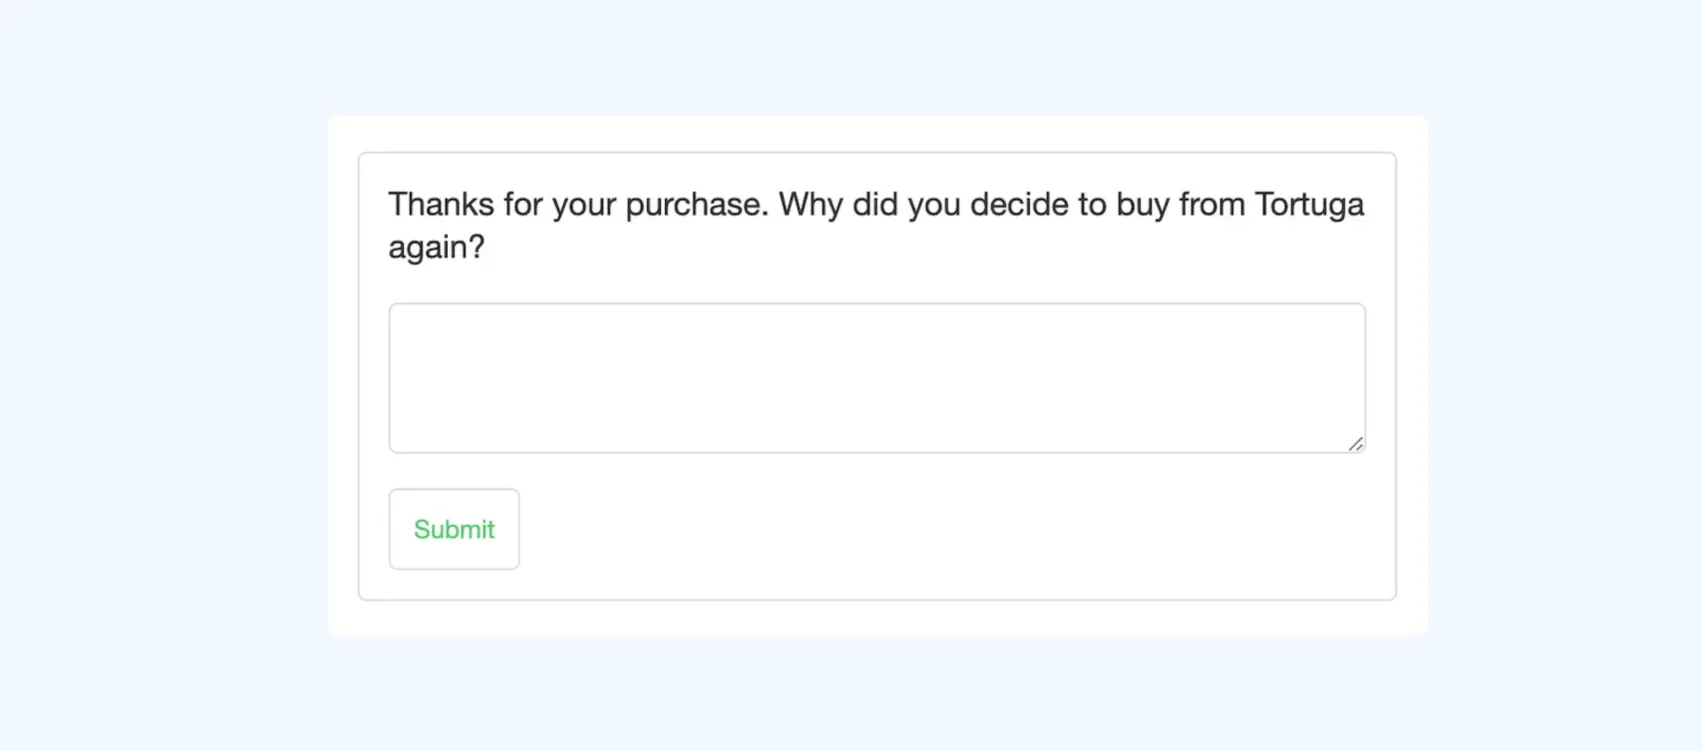
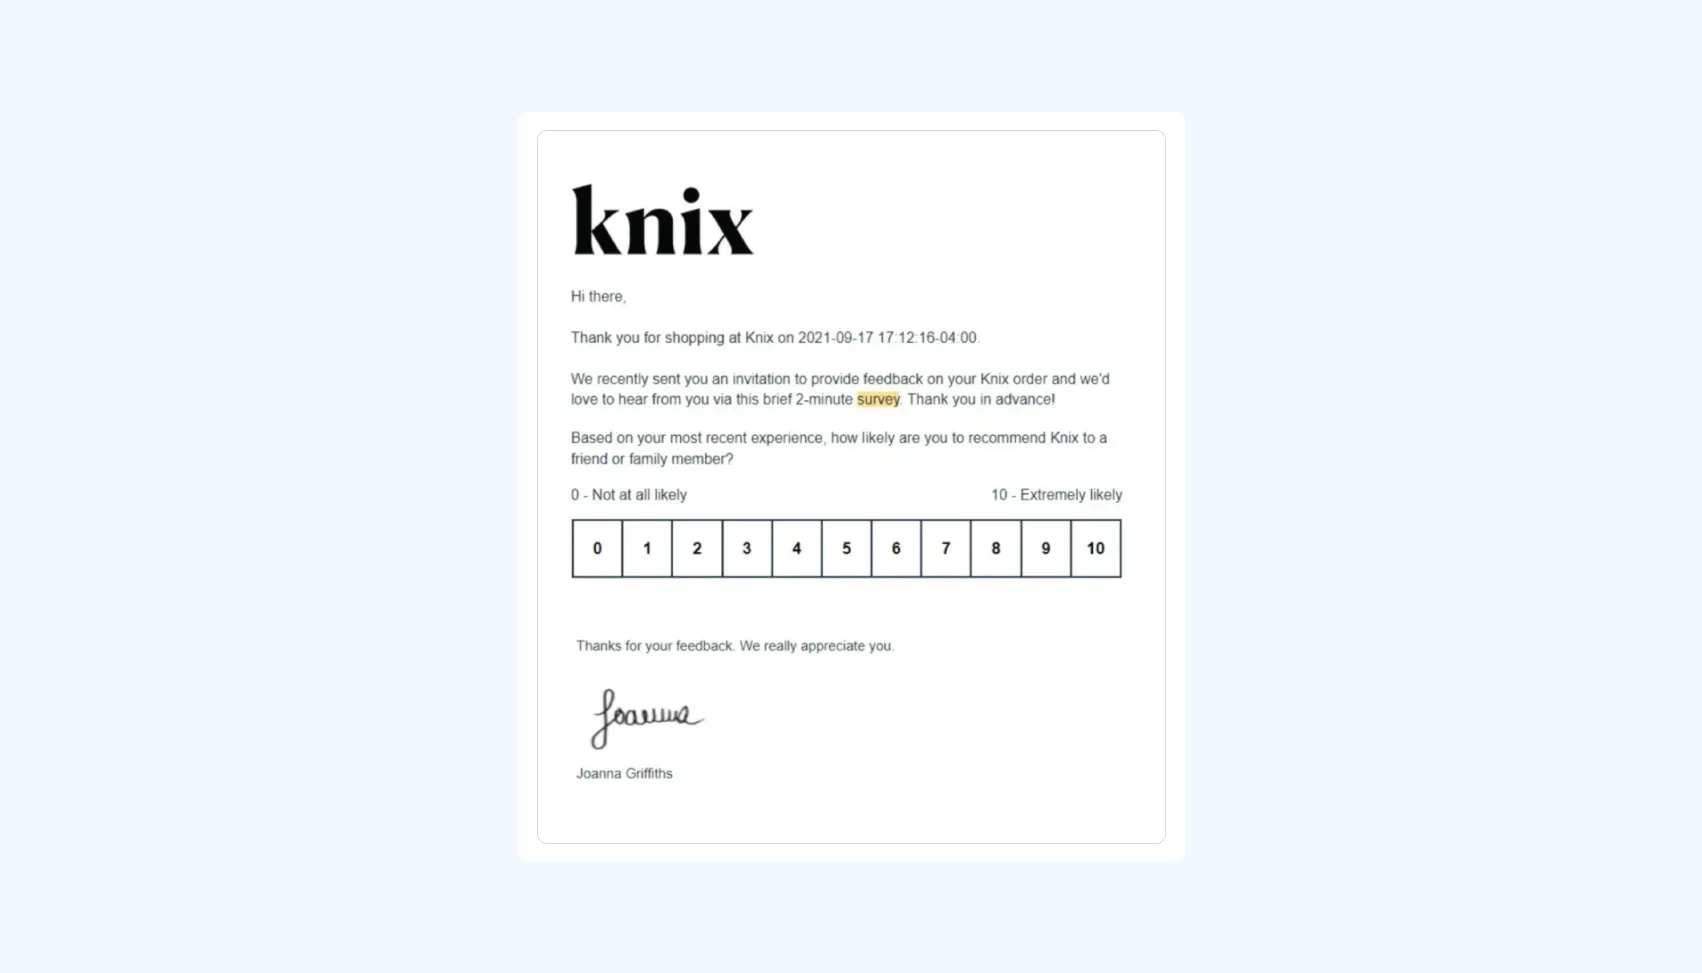
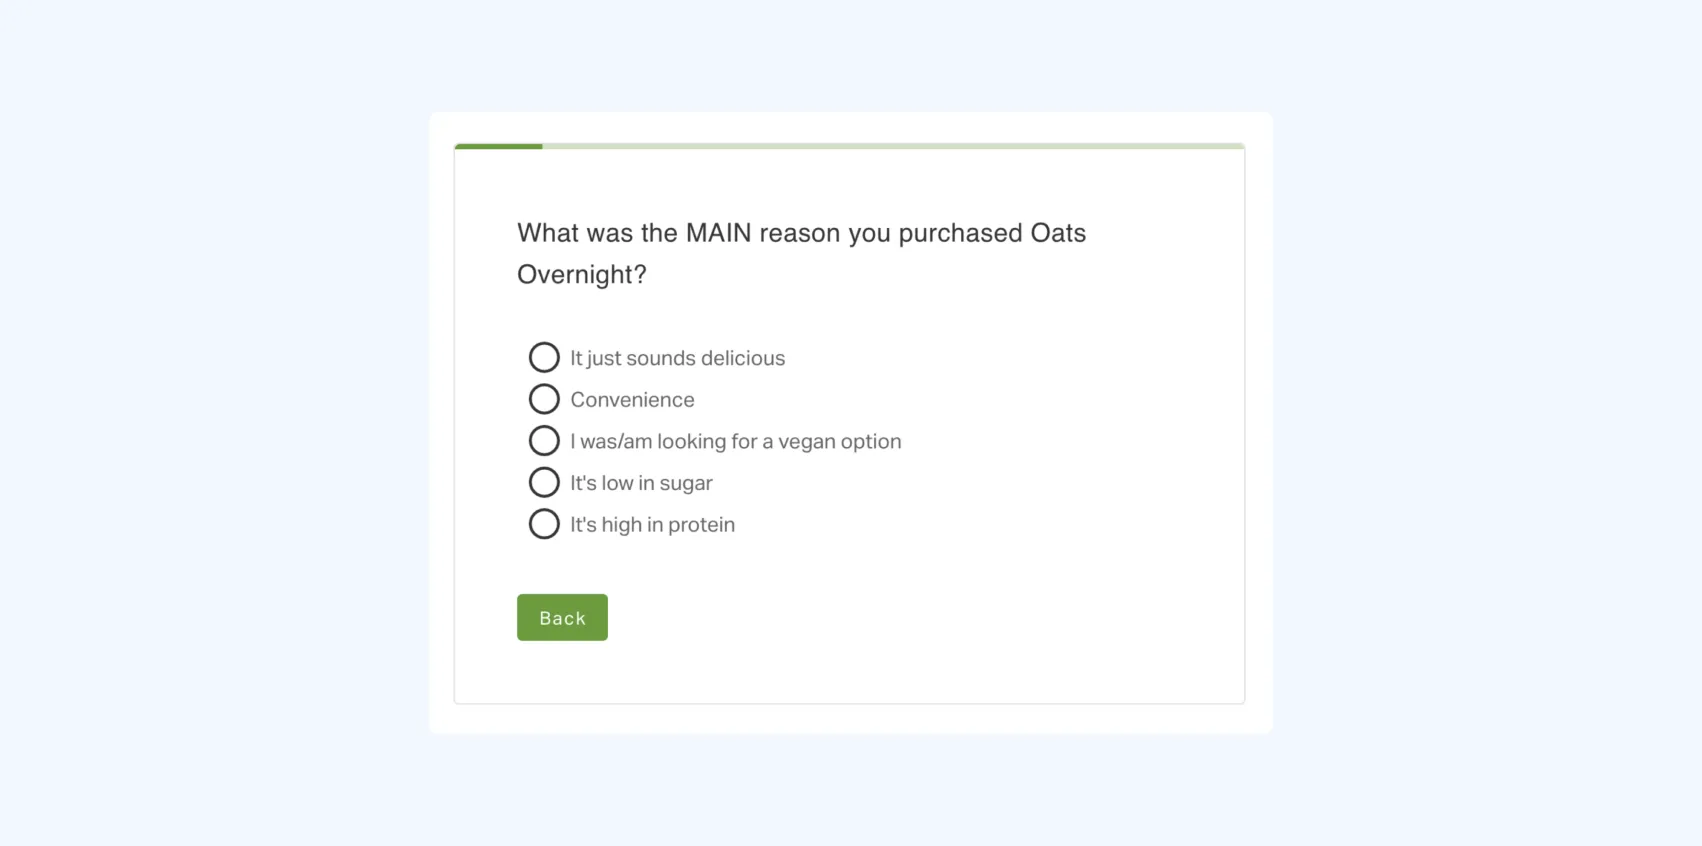
Take a look at the post-purchase survey examples sent from brands and businesses at different times and touch-points.
Now that you know how to word your questionnaire, it’s time to find the right channel for placing your survey. Each channel comes with its own advantages, challenges, and ideal use cases. Keep in mind that the average survey response rate across all methods is around 20-25%.
Immediately after checkout, a pop-up or embedded post-purchase evaluation captures quick feedback about the purchase process.
With a 40–50% response rate, short surveys sent via text message can be a quick and convenient way to get feedback.
With a 15–25% typical response rate, email surveys are an effective way to gather post-purchase feedback, especially when timed strategically.
With a 20–30% participation rate, these surveys offer a timely opportunity to gather feedback while the customer’s ecommerce experience is still fresh and relevant.
QR code surveys use scannable codes printed on packaging, receipts, or inserts that link customers directly to a short feedback form.
Many companies report social media surveys performing at the lower end of the response scale compared to other channels.
To get the most value from every response, it’s important to follow a few proven best practices that maximize participation and ensure the data you collect truly reflects your customers’ experiences.
For some brands, adding a post-purchase survey directly on the Thank You page is the best way to capture real-time feedback while the shopping experience is still fresh.
Research from Gartner reveals that feedback collected at the point-of-experience is 40% more accurate than feedback collected even a day later.
Ultimately, the ideal timing depends on your survey goals:
“Short surveys with just 1-3 questions are incredibly effective, with 83.34% of people completing them” according to Survey Sparrow. Keeping your ecommerce survey questions concise not only respects the customer’s time but also increases the likelihood of thoughtful, accurate responses.
Sure, including a customer’s name or location adds a nice touch, but true personalization goes deeper than that. For instance, there’s no need to ask returning customers how they first discovered your brand. Instead, tailor your survey questions to their current ecommerce post-purchase experience.
Because you only have a brief window to capture feedback, keep your survey short and to the point. Focus on clear, easy-to-measure questions, and avoid phrasing that might influence your customers’ answers. This ensures the feedback you collect reflects their genuine opinions.
Including a mix of question types helps you collect well-rounded insights. Close-ended questions provide quantitative data you can measure and track over time, while open-ended questions capture the qualitative context.
The best platforms integrate directly with your eCommerce stack. That way your post-purchase survey is connected to Shopify, Klaviyo, or Attentive, so feedback flows seamlessly into your existing workflows.
Small rewards like discount codes, loyalty points, or early access to new products can boost participation without biasing responses.
Show customers that their feedback matters. Share updates or improvements inspired by survey responses to strengthen trust and encourage future participation.
Once you’ve had your surveys running for a period of time and you’ve collected enough data, you can move on to uncovering the insights!
Here are just a few things you can do with your post-purchase feedback:
When you gather the zero-party data from customers, you can then learn which marketing channels are driving the most impact.
For example, if Triple Whale doesn’t capture an ad click or referring source for a customer, the survey data will attribute the revenue to the customer-reported sales channel when answering: “where did you hear about us?”
You can learn more about your customer’s path to purchase as well as how long it takes them to convert along the way. For many brands, word of mouth is actually 4x faster at converting than Facebook ads. You can leverage this data to optimize the paths to purchase that have the most friction.
This feedback can help you evaluate your brand’s performance.
With our partner KNO, we have access to data from 1200+ KNO customers combined with over 6500 Triple Whale customers, you can compare your brand’s performance to similar brands within your industry or size.
Respond to complaints promptly, ideally with a personal follow-up email or message offering help. Turning a poor experience into a positive one can rebuild trust and even increase loyalty over time.
Use customer feedback to sharpen your messaging and creative. The language your customers use in surveys can also inform ad copy, landing pages, and email content that resonates more authentically.
Patterns in survey feedback often point to opportunities for innovation. If multiple customers mention the same frustration or request a specific feature, treat it as a roadmap signal.
Triple Whale offers a free post-purchase survey tool as part of our product. If you are not yet using Triple Whale, Fairing and KnoCommerce are two great PPS options for e-commerce brands.
The best part is that they are both technology partners with Triple Whale, meaning they integrate directly with our platform for seamless zero-party data analysis.
If you’re a Shopify and Triple Whale user, you can install Triple Whale’s Post-Purchase Survey for free following these instructions.
Since clicks only tell part of the story, Total Impact combines first-party data, zero-party data, and our shiny, beautiful, proprietary algorithm to give us the very holistic Total Impact Attribution Model.

The model works by analyzing the customer journey from the initial touchpoint to the purchase (and beyond). By taking a wide range of factors into account, including survey data, ad impressions, clicks, website visits, email opens, and more - Total Impact shows us a more detailed picture.
The best time to use the Total Impact model is when you want to visualize the weighted success of your marketing sources, channels, campaigns, adsets and ads, with your store’s revenue distributed based on which channels provide the most impact on the purchase decision. To learn more about Total Impact and how to set it up for your store, check out this article in our knowledge base.
By asking the right questions and keeping surveys short and focused, you can uncover just which channels are the most successful to guide your future marketing efforts.
Additionally, post-purchase surveys can also be useful for understanding any pain points along the customer journey you can improve to keep them coming back to your brand, as well as recommending to their friends. Which is the best way to keep the new customers coming!
Interested to learn what Total Impact can do for you? Book a demo with our team!
Timing depends on your survey goals, but the best responses come when the experience is still fresh. Gartner says feedback collected at the point-of-experience is 40% more accurate than feedback collected even a day later.
You can install Triple Whale’s Post-Purchase Survey for free! A couple of our favorite platforms are also KnoCommerce or Fairing for post-purchase surveys.
They reinforce a customer’s decision to purchase from your brand by showing genuine interest in their experience and listening to their feedback.
Keep it short: 1 to 3 questions max to maintain completion rate.
Avoid long surveys, leading questions that may influence their post-purchase decision, irrelevant questions (surveying for the sake of surveying), and failing to act on the feedback you collect.
You got the sale — nice!
It’s the moment every business works toward. But rather than treating this as the finish line, you can capitalize on this moment using post-purchase surveys. They’re excited and invested, making them more willing to share honest feedback.
Post-purchase surveys are questionnaires brands send to customers right after they’ve bought something from their online store. These short, targeted actions are designed to gather valuable feedback.
These surveys are especially helpful for eCommerce brands and subscription-based businesses that want to understand their customers better and see how they can improve the shopping experience, customer service, and product improvements.
They are also extremely helpful for service-based businesses, such as SaaS platforms or agencies, that want to optimize customer acquisition, improve retention, and refine their post-purchase experience.
Zero-party data is data that your customer is directly providing you. It could come from post-purchase survey data, but is also typically from email/sms capture, preference pages as users share their preferences, interests, and needs with a brand.
Post-purchase surveys are arguably the most effective way to collect zero-party data. Below are some of the many benefits to using PPS for zero-party data.
By understanding and addressing customer experience through post-purchase surveys, you can strengthen customer relationships and drive long-term success for your business.
Because this data is shared with consent, you get targeted personalization opportunities (e.g., location, age, interests, hobbies, preferred language) that you can use to tailor experiences, power precise segmentation, make smarter recommendations, and create more relevant campaigns.
Post-purchase surveys can uncover product-specific insights that internal teams might miss.
For example, you might learn that customers appreciate certain product features but find the instructions unclear, or that they struggled to locate key information on your site. These details are invaluable for refining your product design, packaging, or overall user experience.
When you ask targeted questions about product satisfaction, quality, or usability, you can identify potential issues before they lead to returns or support tickets.
Even better – you can address those concerns proactively by updating product descriptions, FAQs, or troubleshooting materials.
These questionnaires show customers that their opinions matter, solidifying why they feel good about their post-purchase decision. When you act on their input with updates or product improvements, you build trust and connection.
Following up with satisfied customers can also spark loyalty, referrals, and repeat purchases.
Below are some of the best post-purchase survey questions to ask, tailored to your specific business goals and the stage of the customer journey you want to better understand.
Conversion rate optimization (CRO) insights reveal exactly where customer engagement might be dropping off or what convinces them to stay. When aggregated, they can inform site optimizations, product page improvements, and better messaging that directly impact conversion rates.
Use personalization questions to better understand your target demographic. By learning about their interests, habits, and preferences, you can create more relevant product recommendations, refine your messaging, and deliver experiences that feel genuinely individualized.
Pinpoint marketing attribution and learn about all the channels driving customers to your shop using attribution questions. Here are some questions to help you go beyond the “how did you hear about us?” template (although the classic question still works!).
By learning how customers use, perceive, and evaluate your product, you can identify opportunities for improvement, innovation, or even new product development. Here are some survey questions to ask about a product.
When aggregated, these questions can inform UX improvements, post-purchase communication strategies, and operational changes that strengthen overall satisfaction and retention.
Pricing plays a huge role in shaping customer perception and purchase decisions. These questions help you understand how customers view your pricing, helping you calculate competitive pricing strategies, opportunities, and promotions.
Take a look at the post-purchase survey examples sent from brands and businesses at different times and touch-points.
Now that you know how to word your questionnaire, it’s time to find the right channel for placing your survey. Each channel comes with its own advantages, challenges, and ideal use cases. Keep in mind that the average survey response rate across all methods is around 20-25%.
Immediately after checkout, a pop-up or embedded post-purchase evaluation captures quick feedback about the purchase process.
With a 40–50% response rate, short surveys sent via text message can be a quick and convenient way to get feedback.
With a 15–25% typical response rate, email surveys are an effective way to gather post-purchase feedback, especially when timed strategically.
With a 20–30% participation rate, these surveys offer a timely opportunity to gather feedback while the customer’s ecommerce experience is still fresh and relevant.
QR code surveys use scannable codes printed on packaging, receipts, or inserts that link customers directly to a short feedback form.
Many companies report social media surveys performing at the lower end of the response scale compared to other channels.
To get the most value from every response, it’s important to follow a few proven best practices that maximize participation and ensure the data you collect truly reflects your customers’ experiences.
For some brands, adding a post-purchase survey directly on the Thank You page is the best way to capture real-time feedback while the shopping experience is still fresh.
Research from Gartner reveals that feedback collected at the point-of-experience is 40% more accurate than feedback collected even a day later.
Ultimately, the ideal timing depends on your survey goals:
“Short surveys with just 1-3 questions are incredibly effective, with 83.34% of people completing them” according to Survey Sparrow. Keeping your ecommerce survey questions concise not only respects the customer’s time but also increases the likelihood of thoughtful, accurate responses.
Sure, including a customer’s name or location adds a nice touch, but true personalization goes deeper than that. For instance, there’s no need to ask returning customers how they first discovered your brand. Instead, tailor your survey questions to their current ecommerce post-purchase experience.
Because you only have a brief window to capture feedback, keep your survey short and to the point. Focus on clear, easy-to-measure questions, and avoid phrasing that might influence your customers’ answers. This ensures the feedback you collect reflects their genuine opinions.
Including a mix of question types helps you collect well-rounded insights. Close-ended questions provide quantitative data you can measure and track over time, while open-ended questions capture the qualitative context.
The best platforms integrate directly with your eCommerce stack. That way your post-purchase survey is connected to Shopify, Klaviyo, or Attentive, so feedback flows seamlessly into your existing workflows.
Small rewards like discount codes, loyalty points, or early access to new products can boost participation without biasing responses.
Show customers that their feedback matters. Share updates or improvements inspired by survey responses to strengthen trust and encourage future participation.
Once you’ve had your surveys running for a period of time and you’ve collected enough data, you can move on to uncovering the insights!
Here are just a few things you can do with your post-purchase feedback:
When you gather the zero-party data from customers, you can then learn which marketing channels are driving the most impact.
For example, if Triple Whale doesn’t capture an ad click or referring source for a customer, the survey data will attribute the revenue to the customer-reported sales channel when answering: “where did you hear about us?”
You can learn more about your customer’s path to purchase as well as how long it takes them to convert along the way. For many brands, word of mouth is actually 4x faster at converting than Facebook ads. You can leverage this data to optimize the paths to purchase that have the most friction.
This feedback can help you evaluate your brand’s performance.
With our partner KNO, we have access to data from 1200+ KNO customers combined with over 6500 Triple Whale customers, you can compare your brand’s performance to similar brands within your industry or size.
Respond to complaints promptly, ideally with a personal follow-up email or message offering help. Turning a poor experience into a positive one can rebuild trust and even increase loyalty over time.
Use customer feedback to sharpen your messaging and creative. The language your customers use in surveys can also inform ad copy, landing pages, and email content that resonates more authentically.
Patterns in survey feedback often point to opportunities for innovation. If multiple customers mention the same frustration or request a specific feature, treat it as a roadmap signal.
Triple Whale offers a free post-purchase survey tool as part of our product. If you are not yet using Triple Whale, Fairing and KnoCommerce are two great PPS options for e-commerce brands.
The best part is that they are both technology partners with Triple Whale, meaning they integrate directly with our platform for seamless zero-party data analysis.
If you’re a Shopify and Triple Whale user, you can install Triple Whale’s Post-Purchase Survey for free following these instructions.
Since clicks only tell part of the story, Total Impact combines first-party data, zero-party data, and our shiny, beautiful, proprietary algorithm to give us the very holistic Total Impact Attribution Model.
The model works by analyzing the customer journey from the initial touchpoint to the purchase (and beyond). By taking a wide range of factors into account, including survey data, ad impressions, clicks, website visits, email opens, and more - Total Impact shows us a more detailed picture.
The best time to use the Total Impact model is when you want to visualize the weighted success of your marketing sources, channels, campaigns, adsets and ads, with your store’s revenue distributed based on which channels provide the most impact on the purchase decision. To learn more about Total Impact and how to set it up for your store, check out this article in our knowledge base.
By asking the right questions and keeping surveys short and focused, you can uncover just which channels are the most successful to guide your future marketing efforts.
Additionally, post-purchase surveys can also be useful for understanding any pain points along the customer journey you can improve to keep them coming back to your brand, as well as recommending to their friends. Which is the best way to keep the new customers coming!
Interested to learn what Total Impact can do for you? Book a demo with our team!
Timing depends on your survey goals, but the best responses come when the experience is still fresh. Gartner says feedback collected at the point-of-experience is 40% more accurate than feedback collected even a day later.
You can install Triple Whale’s Post-Purchase Survey for free! A couple of our favorite platforms are also KnoCommerce or Fairing for post-purchase surveys.
They reinforce a customer’s decision to purchase from your brand by showing genuine interest in their experience and listening to their feedback.
Keep it short: 1 to 3 questions max to maintain completion rate.
Avoid long surveys, leading questions that may influence their post-purchase decision, irrelevant questions (surveying for the sake of surveying), and failing to act on the feedback you collect.


Body Copy: The following benchmarks compare advertising metrics from April 1-17 to the previous period. Considering President Trump first unveiled his tariffs on April 2, the timing corresponds with potential changes in advertising behavior among ecommerce brands (though it isn’t necessarily correlated).


.webp)

.webp)


.png)


.png)
.png)
.png)