For ecommerce companies, information is gold. You track revenue, operational cost, promotions, inventory, and much more.
This wealth of information helps you spot market trends so you can plan out your online store accordingly, stop issues in their tracks so things run smoothly, and understand the customer journey so you can optimize toward more conversions.
However, many business owners quickly become buried underneath that mountain of data. There are two main reasons why:
It’s too much to decipher. There are many tools out there that can help you collect ecommerce analytics and track your KPIs – that’s to say, if you're not doing it all old school on spreadsheets! But even with tools to help, many people can't streamline the information enough to generate customized reports and understand KPIs in a digestible way.
It’s time-consuming. Gathering the data, organizing it, analyzing it, and actually using the data to drive change takes a lot of time and effort – especially when you have multiple teams/departments that have to go through this process. Valuable time is wasted trying to keep things up to date in a way that makes sense.
If that sounds familiar, an ecommerce dashboard solves both problems at once.
TL;DR: How do I set up an ecommerce dashboard?
Connect data sources: Plug in Shopify, WooCommerce, Meta ads, and whichever platforms you need to use.
Choose a starter template: Most ecommerce dashboards come with templates, but you can also customize to create separate views for different roles.
Pick your KPIs: AOV, CAC, MER, and whatever else your role needs to monitor.
Share it to mobile so your team can check it from the app.
Why do you need a dashboard for ecommerce?
An ecommerce dashboard provides a bird's-eye view of the essential elements needed to run your ecommerce business at any given moment. It does so by tracking and analyzing key data and KPIs.
The data you use to populate your ecommerce dashboard must come from somewhere. Most small businesses start this new adventure with built-in dashboards that automatically come in their ecommerce platforms, such as Shopify Analytics or Google Analytics.
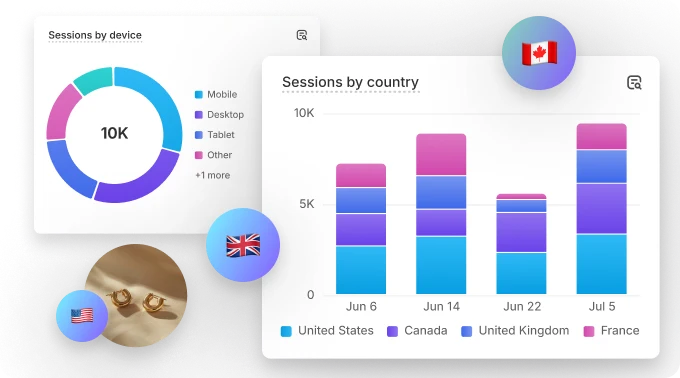
Shopify Dashboard: Sessions
While this is a great way to dip your toes into ecommerce dashboards, they’re not tailored to your specific needs, the number of stores you run, or multiple dashboards you may need to view on any given day.
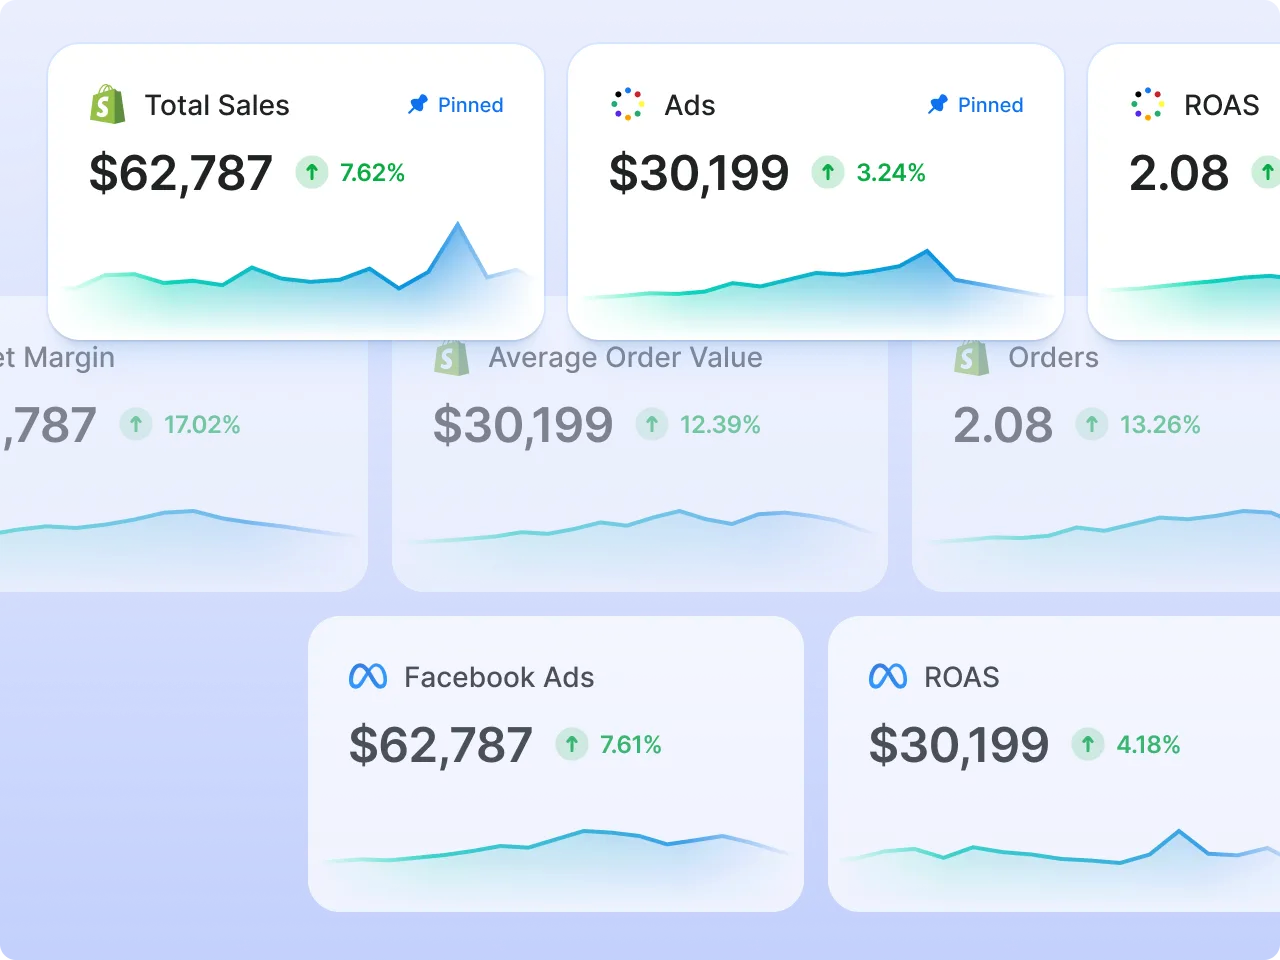
Once you're ready to go further, customizable ecommerce dashboards pull from multiple sources at once: Shopify, your ad platforms, email and SMS tools, and site analytics. The dashboard brings that data together so you can sign in once and see how your store is actually doing.
Benefits of a centralized dashboard for ecommerce
They make your life easier.
Honestly, it’s arguably the best benefit – because who doesn’t want to simplify the data? Dashboards, contrary to ecommerce analytics tools and reports, shine a light on the vital information you really care about. That means you can always have the need-to-know at hand, and dive into other metrics when you have the time and urgency for it.
They can help you fix critical issues quicker.
Similar to what’s mentioned above, ecommerce dashboards display only what you need to see on a daily basis. It’s plausible you’d want to see operational metrics such as unanswered tickets, support issues, slow fulfillment orders, slow web speed, or low stock, for example. If you get to monitor such critical information in a streamlined way, you can fix such issues much faster.
Dashboards can boost morale.
Seeing your progress can give everyone on the team a bit of extrinsic motivation. You can utilize dashboards to spark some healthy competition and keep everyone engaged with how their respective numbers are going. Use it to track sales revenue split by market, top products, conversations for campaigns, and even followers on social networks, and more.
They save a bunch of time.
It may be obvious, but dashboards solve many pain points for your ecommerce business as it grows. Minutes shaved off everyone’s day to log in to different workspaces and dig through numbers really add up. Many dashboards also allow you to bookmark numbers you want to track for yourself and easily share those numbers with others.
Steps to take before setting up your dashboard for ecommerce
Think about who uses your dashboard
As in, who’s actually looking at this thing? Everyone on your team reads the same numbers differently.
Think about your goal for its use
A CEO typically wants strategic numbers: revenue, acquisition cost, margin. A media buyer wants channel-level performance they can act on today. Match the dashboard to the decision it needs to support.
Build a decision-led KPI framework
A handful of well-chosen metrics beats a wall of numbers. The trick is picking metrics tied to a specific decision, not just a category you're supposed to track. For more on this topic, check out Understanding Ecommerce Metrics.
Don't overlook data visualization. Your dashboard needs to be something you can read in seconds, not something that wears you out.
Percentages tend to read best as pie charts. Bar charts compare values cleanly. A treemap handles hierarchies well, and a table earns its place when you need granular detail. Most dashboard tools let you match colors to your brand, which helps you scan by hue instead of hunting for labels.
Native Dashboards vs. a Consolidated Tool
Dimension
Shopify + GA4 (Native)
Triple Whale
Setup Time
Live on day one, but building matched views across two separate tools takes manual work
Connect Shopify, pick a template or build from scratch, live in minutes (onboarding guide)
Attribution Options
Shopify defaults to last-click; GA4 adds a few rule-based and data-driven models in a separate login
Seven documented attribution models today, single-touch through multi-touch, selectable per dashboard (attribution models)
Source Coverage
Shopify covers store data, GA4 covers site behavior, ad platforms live in a third place
Shopify, ad platforms, email/SMS, and site data blended into one warehouse via Triple Pixel (Pixel)
Collaboration
View-only sharing per platform, no shared workspace across the three
Editable dashboards shared across the team, with permissions by role
Mobile Access
Shopify’s app is mobile-native; GA4’s app is read-only and limited
Free app with every desktop feature carried over (mobile app)
Set up a Triple Whale dashboard in minutes
Triple Whale ecommerce dashboard metrics
Straight out of the box, Triple Whale ships four standard dashboards:
Summary: Summary aggregates your core metrics across every connected source.
Pixel: Pixel covers first-party attribution and campaign analytics.
To build a custom dashboard, click Add, then Dashboard. You can start from a template in the Template Library or click Create New Dashboard from Scratch.
From there, three ways exist to fill it in:
Ask Moby. Chat with your AI data analyst in plain language and add the answer straight to the dashboard.
Use the Metric Library. Build a table from specific data points across your connected channels, then add filters and sort order.
Write SQL. The Custom SQL Builder lets analysts query the data warehouse directly for anything the first two methods don't cover.
Every dashboard also carries its own Moby chat, so anyone on your team can ask a question about what's in front of them and get an answer without leaving the page.
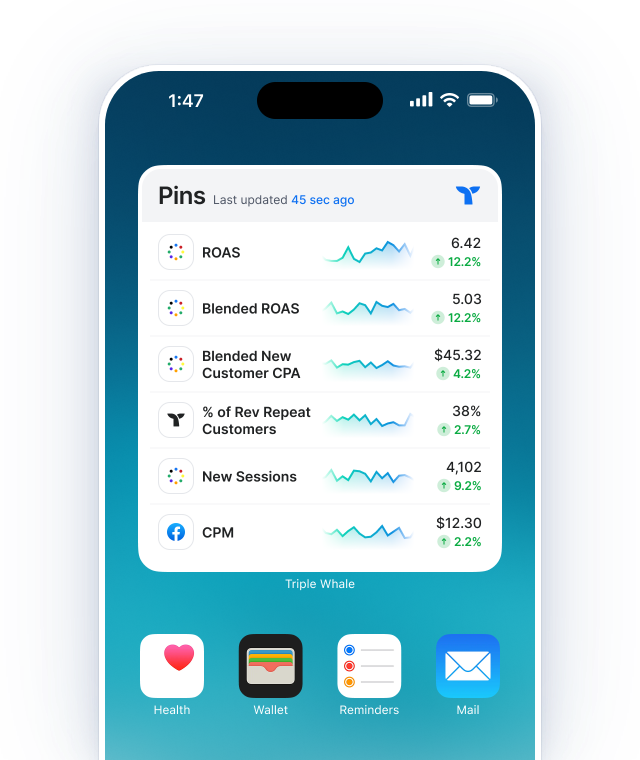
Once it's built, share the dashboard with your team and check it from the free mobile app. Every feature available on desktop carries over, so nobody's stuck waiting to get back to a laptop for a number that matters right now.
Triple Whale ecommerce dashboard on mobile app
Set up an actionable ecommerce dashboard today
A well-built dashboard turns raw data into a decision you can make before lunch. Instead of sifting through spreadsheets, connect your sources, pick the metrics tied to your role, and let the dashboard tell you when to act.
Bring your data together in one platform built for brands of every size, so you can track performance, catch what's changing, and decide faster.
Triple Whale brings the metrics that matter most into one easy-to-use dashboard, giving you the real-time insights you need to grow your brand. Get started for free.
FAQs About Ecommerce Dashboards
What is an ecommerce dashboard?
An ecommerce dashboard brings important sales, marketing, customer, product, and profitability metrics into one view. It helps teams monitor performance, identify meaningful changes, and make decisions without manually combining reports from multiple platforms.
What should an ecommerce dashboard include?
The right metrics depend on the decisions the dashboard supports. Common ecommerce dashboard KPIs include net sales, orders, average order value, conversion rate, ad spend, MER, acquisition cost, new-customer revenue, lifetime value, returns, net profit, and net margin.
What is the difference between an ecommerce dashboard and Shopify Analytics?
Shopify Analytics provides native reporting for store activity, including sales, orders, sessions, customers, and products. A platform such as Triple Whale can combine store data with advertising, attribution, customer, product, retention, and cost data to provide a broader view of business performance.
How do I create an ecommerce dashboard in Triple Whale?
First, connect your ecommerce store and relevant integrations, install and verify the Triple Pixel, configure tracking parameters, and add applicable cost data. You can then select a dashboard from the Template Library or build one from scratch using Moby, the Metric Library, or the Custom SQL Builder.
Can I customize my Triple Whale dashboard?
Yes. You can create dashboards for particular teams, goals, or reporting workflows. Metrics and visualizations can be added through Moby, the Metric Library, or custom SQL, depending on the level of customization required.
Component Sales
5.32K
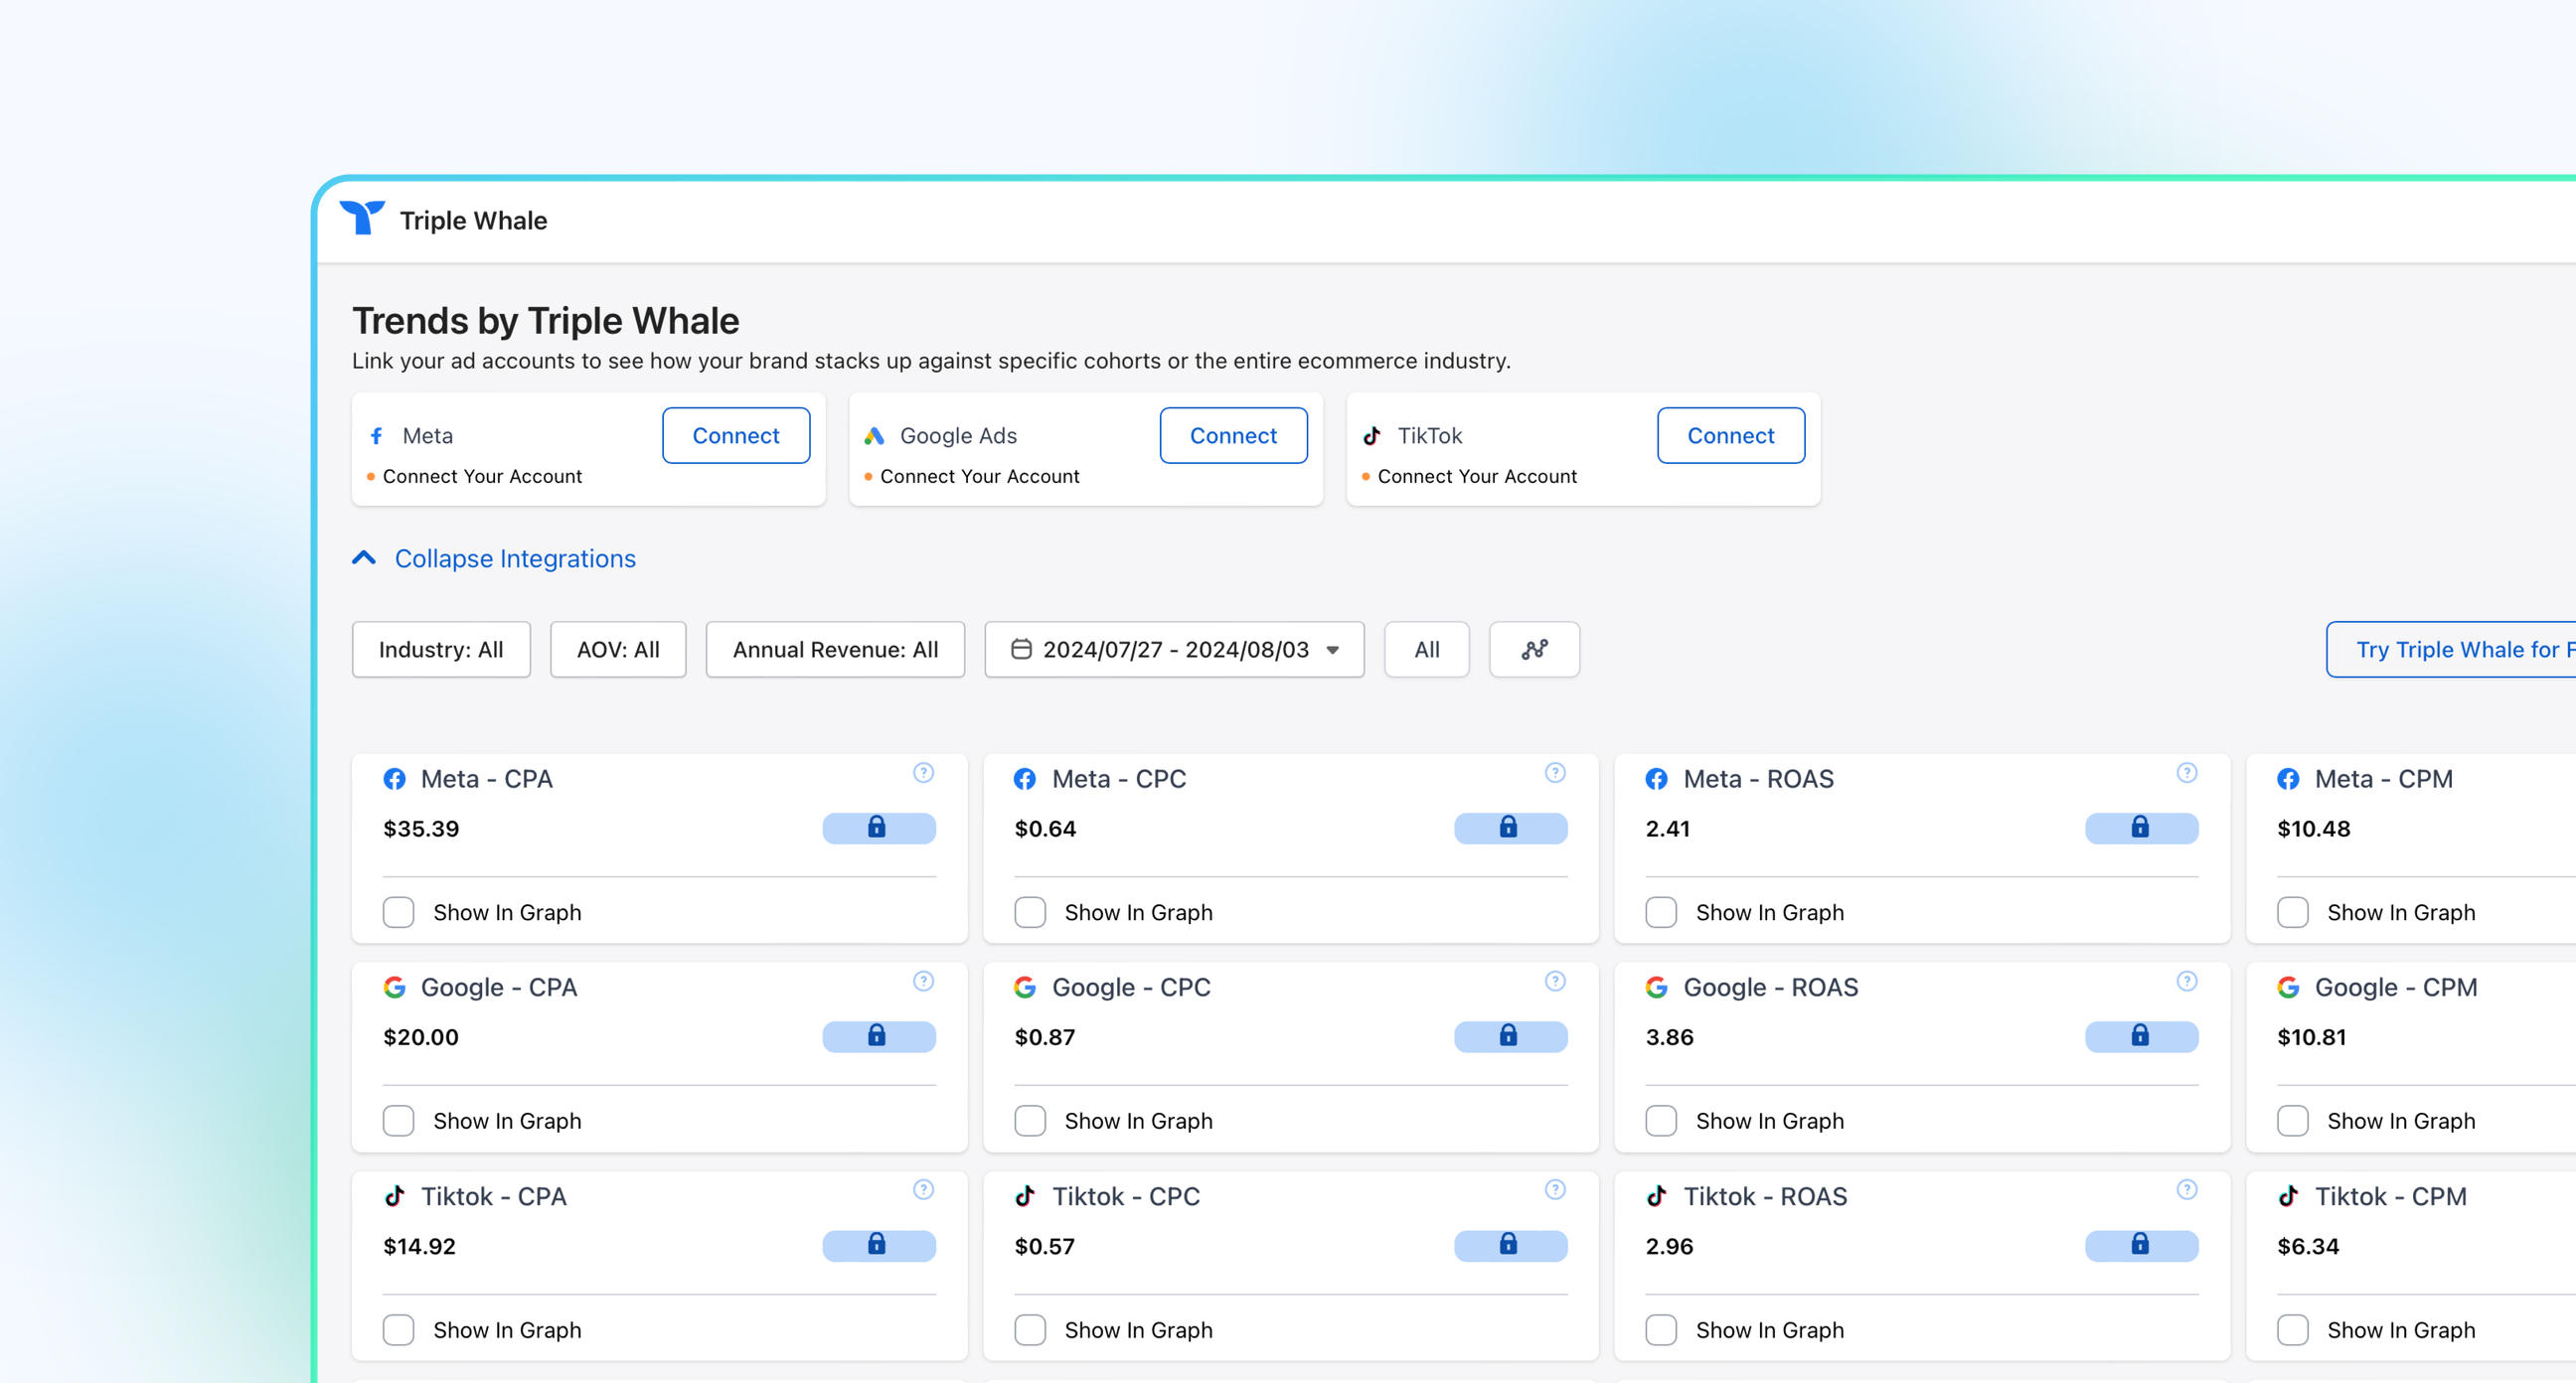
Benchmark your ecommerce brand against industry leaders
For ecommerce companies, information is gold. You track revenue, operational cost, promotions, inventory, and much more.
This wealth of information helps you spot market trends so you can plan out your online store accordingly, stop issues in their tracks so things run smoothly, and understand the customer journey so you can optimize toward more conversions.
However, many business owners quickly become buried underneath that mountain of data. There are two main reasons why:
It’s too much to decipher. There are many tools out there that can help you collect ecommerce analytics and track your KPIs – that’s to say, if you're not doing it all old school on spreadsheets! But even with tools to help, many people can't streamline the information enough to generate customized reports and understand KPIs in a digestible way.
It’s time-consuming. Gathering the data, organizing it, analyzing it, and actually using the data to drive change takes a lot of time and effort – especially when you have multiple teams/departments that have to go through this process. Valuable time is wasted trying to keep things up to date in a way that makes sense.
If that sounds familiar, an ecommerce dashboard solves both problems at once.
TL;DR: How do I set up an ecommerce dashboard?
Connect data sources: Plug in Shopify, WooCommerce, Meta ads, and whichever platforms you need to use.
Choose a starter template: Most ecommerce dashboards come with templates, but you can also customize to create separate views for different roles.
Pick your KPIs: AOV, CAC, MER, and whatever else your role needs to monitor.
Share it to mobile so your team can check it from the app.
Why do you need a dashboard for ecommerce?
An ecommerce dashboard provides a bird's-eye view of the essential elements needed to run your ecommerce business at any given moment. It does so by tracking and analyzing key data and KPIs.
The data you use to populate your ecommerce dashboard must come from somewhere. Most small businesses start this new adventure with built-in dashboards that automatically come in their ecommerce platforms, such as Shopify Analytics or Google Analytics.
Shopify Dashboard: Sessions
While this is a great way to dip your toes into ecommerce dashboards, they’re not tailored to your specific needs, the number of stores you run, or multiple dashboards you may need to view on any given day.
Once you're ready to go further, customizable ecommerce dashboards pull from multiple sources at once: Shopify, your ad platforms, email and SMS tools, and site analytics. The dashboard brings that data together so you can sign in once and see how your store is actually doing.
Benefits of a centralized dashboard for ecommerce
They make your life easier.
Honestly, it’s arguably the best benefit – because who doesn’t want to simplify the data? Dashboards, contrary to ecommerce analytics tools and reports, shine a light on the vital information you really care about. That means you can always have the need-to-know at hand, and dive into other metrics when you have the time and urgency for it.
They can help you fix critical issues quicker.
Similar to what’s mentioned above, ecommerce dashboards display only what you need to see on a daily basis. It’s plausible you’d want to see operational metrics such as unanswered tickets, support issues, slow fulfillment orders, slow web speed, or low stock, for example. If you get to monitor such critical information in a streamlined way, you can fix such issues much faster.
Dashboards can boost morale.
Seeing your progress can give everyone on the team a bit of extrinsic motivation. You can utilize dashboards to spark some healthy competition and keep everyone engaged with how their respective numbers are going. Use it to track sales revenue split by market, top products, conversations for campaigns, and even followers on social networks, and more.
They save a bunch of time.
It may be obvious, but dashboards solve many pain points for your ecommerce business as it grows. Minutes shaved off everyone’s day to log in to different workspaces and dig through numbers really add up. Many dashboards also allow you to bookmark numbers you want to track for yourself and easily share those numbers with others.
Steps to take before setting up your dashboard for ecommerce
Think about who uses your dashboard
As in, who’s actually looking at this thing? Everyone on your team reads the same numbers differently.
Think about your goal for its use
A CEO typically wants strategic numbers: revenue, acquisition cost, margin. A media buyer wants channel-level performance they can act on today. Match the dashboard to the decision it needs to support.
Build a decision-led KPI framework
A handful of well-chosen metrics beats a wall of numbers. The trick is picking metrics tied to a specific decision, not just a category you're supposed to track. For more on this topic, check out Understanding Ecommerce Metrics.
Don't overlook data visualization. Your dashboard needs to be something you can read in seconds, not something that wears you out.
Percentages tend to read best as pie charts. Bar charts compare values cleanly. A treemap handles hierarchies well, and a table earns its place when you need granular detail. Most dashboard tools let you match colors to your brand, which helps you scan by hue instead of hunting for labels.
Native Dashboards vs. a Consolidated Tool
Dimension
Shopify + GA4 (Native)
Triple Whale
Setup Time
Live on day one, but building matched views across two separate tools takes manual work
Connect Shopify, pick a template or build from scratch, live in minutes (onboarding guide)
Attribution Options
Shopify defaults to last-click; GA4 adds a few rule-based and data-driven models in a separate login
Seven documented attribution models today, single-touch through multi-touch, selectable per dashboard (attribution models)
Source Coverage
Shopify covers store data, GA4 covers site behavior, ad platforms live in a third place
Shopify, ad platforms, email/SMS, and site data blended into one warehouse via Triple Pixel (Pixel)
Collaboration
View-only sharing per platform, no shared workspace across the three
Editable dashboards shared across the team, with permissions by role
Mobile Access
Shopify’s app is mobile-native; GA4’s app is read-only and limited
Free app with every desktop feature carried over (mobile app)
Set up a Triple Whale dashboard in minutes
Triple Whale ecommerce dashboard metrics
Straight out of the box, Triple Whale ships four standard dashboards:
Summary: Summary aggregates your core metrics across every connected source.
Pixel: Pixel covers first-party attribution and campaign analytics.
To build a custom dashboard, click Add, then Dashboard. You can start from a template in the Template Library or click Create New Dashboard from Scratch.
From there, three ways exist to fill it in:
Ask Moby. Chat with your AI data analyst in plain language and add the answer straight to the dashboard.
Use the Metric Library. Build a table from specific data points across your connected channels, then add filters and sort order.
Write SQL. The Custom SQL Builder lets analysts query the data warehouse directly for anything the first two methods don't cover.
Every dashboard also carries its own Moby chat, so anyone on your team can ask a question about what's in front of them and get an answer without leaving the page.
Once it's built, share the dashboard with your team and check it from the free mobile app. Every feature available on desktop carries over, so nobody's stuck waiting to get back to a laptop for a number that matters right now.
Triple Whale ecommerce dashboard on mobile app
Set up an actionable ecommerce dashboard today
A well-built dashboard turns raw data into a decision you can make before lunch. Instead of sifting through spreadsheets, connect your sources, pick the metrics tied to your role, and let the dashboard tell you when to act.
Bring your data together in one platform built for brands of every size, so you can track performance, catch what's changing, and decide faster.
Triple Whale brings the metrics that matter most into one easy-to-use dashboard, giving you the real-time insights you need to grow your brand. Get started for free.
FAQs About Ecommerce Dashboards
What is an ecommerce dashboard?
An ecommerce dashboard brings important sales, marketing, customer, product, and profitability metrics into one view. It helps teams monitor performance, identify meaningful changes, and make decisions without manually combining reports from multiple platforms.
What should an ecommerce dashboard include?
The right metrics depend on the decisions the dashboard supports. Common ecommerce dashboard KPIs include net sales, orders, average order value, conversion rate, ad spend, MER, acquisition cost, new-customer revenue, lifetime value, returns, net profit, and net margin.
What is the difference between an ecommerce dashboard and Shopify Analytics?
Shopify Analytics provides native reporting for store activity, including sales, orders, sessions, customers, and products. A platform such as Triple Whale can combine store data with advertising, attribution, customer, product, retention, and cost data to provide a broader view of business performance.
How do I create an ecommerce dashboard in Triple Whale?
First, connect your ecommerce store and relevant integrations, install and verify the Triple Pixel, configure tracking parameters, and add applicable cost data. You can then select a dashboard from the Template Library or build one from scratch using Moby, the Metric Library, or the Custom SQL Builder.
Can I customize my Triple Whale dashboard?
Yes. You can create dashboards for particular teams, goals, or reporting workflows. Metrics and visualizations can be added through Moby, the Metric Library, or custom SQL, depending on the level of customization required.
Share
Kaleena Stroud
Kaleena Stroud is a copywriter for SaaS and DTC businesses.
Kaleena Stroud
Kaleena Stroud is a content writer at Triple Whale, bringing data stories to life. She spent many years running an online copywriting business, where she helped brands launch and revamp their Shopify stores. Her work has been featured in Practical Ecommerce, Convert, and Create & Cultivate.
Body Copy: The following benchmarks compare advertising metrics from April 1-17 to the previous period. Considering President Trump first unveiled his tariffs on April 2, the timing corresponds with potential changes in advertising behavior among ecommerce brands (though it isn’t necessarily correlated).


 Moby AIAsk questions, analyze performance, and work with your business context.
 ActionsTake governed action across the tools that run your business.
 AutomationsSchedule recurring analysis and work that runs on your terms.
 Landing PagesCreative conversion-focused ecommerce pages with Moby.
 Creative StudioGenerate and refine creative grounded in your brand.











.webp)

.webp)
