
Our Meta Ads benchmarks review common ad performance metrics for Meta Ads (including Facebook and Instagram) across brands that use Triple Whale to monitor and maximize their ad performance.
This analysis includes over 41,000 brands for the period of November 1, 2025 to October 31, 2026.
READ MORE | A Guide to Ecommerce Metrics
Additionally, we’ll break down the vertical-specific trends with data from the following industries:
- Apparel and Accessories
- Beauty
- Home and Garden
- Food and Beverage
- Sports and Outdoors
- Health and Wellness
- Toys, Art and Collectibles
- Pets and Animals
- Electronics
- Lifestyle and Boutique
- Baby
- E-learning and Online Courses
- Books and Music
- Media and Publishing
- Travel Accessories and Luggage
- Medical Devices and Equipment
- Automotive
Overall Meta Ads industry benchmarks
| Metric | Nov 2025 to Oct 2026 | Nov 2024 to Oct 2025 | % Change YoY |
|---|---|---|---|
| CPA | $39.73 | $38.11 | +4.24% |
| CPM | $15.72 | $13.83 | +13.64% |
| CVR | 1.51% | 1.61% | -6.10% |
| ROAS | 1.88 | 1.85 | +1.48% |
| AOV | $74.62 | $71.03 | +5.05% |
| CTR | 2.48% | 2.12% | +17.22% |
| MER | 0.49 | 0.49 | -1.03% |
The overall ad performance data for Meta Ads from November 2025 to October 2026 reflects a platform where audience reach remains broad, but efficiency varies significantly by vertical.
Meta continues to command the dominant share of ecommerce spend (Triple Whale brands invested 67.34% of their total ad budget on Meta in the current period), and with that dominance comes increased competition and rising costs across the board.
The median CPA across all industries landed at $39.73, and CPM sat at $15.72, reflecting the premium brands pay to reach audiences in a crowded auction environment.
The median ROAS of 1.88 and CVR of 1.51% suggest that while Meta drives significant volume, efficiency varies considerably by vertical.
The median CTR of 2.48% signals that Meta’s visual ad formats continue to generate strong top-of-funnel engagement. The challenge lies in converting that interest into purchases.
Understanding where your industry sits within this benchmark is essential for setting realistic goals and building an ad strategy that can survive Meta’s high-cost environment heading into 2027.
Meta Ad performance benchmarks by industry
| Industry | Median CPA | % Change YoY |
|---|---|---|
| Apparel and Accessories | $37.41 | +1.66% |
| Beauty | $40.44 | +7.50% |
| Home and Garden | $48.61 | +5.99% |
| Food and Beverage | $39.30 | +2.60% |
| Health and Wellness | $42.30 | +10.73% |
| Sports and Outdoors | $45.30 | +3.47% |
| Toys, Art, and Collectibles | $34.63 | -1.79% |
| Pets and Animals | $39.23 | +2.46% |
| Electronics | $51.06 | +4.70% |
| Lifestyle and Boutique | $32.04 | +6.56% |
| Baby | $29.87 | +0.07% |
| E-learning and Online Courses | $27.92 | +5.89% |
| Books and Music | $30.98 | +3.18% |
| Media and Publishing | $37.53 | +10.05% |
| Travel Accessories and Luggage | $52.30 | +6.76% |
| Medical Devices and Equipment | $48.25 | -12.49% |
| Automotive | $35.63 | +3.98% |
Cost per acquisition (CPA) measures how much it costs to acquire one customer. On Meta from November 2025 to October 2026, three of the 17 industries in the dataset saw CPA improve year over year, while 14 got more expensive.
The standout improvers were Medical Devices and Equipment (-12.49%) and Toys, Art, and Collectibles (-1.79%). Both industries brought their cost per customer down even as the overall auction grew more competitive.
E-learning and Online Courses retained the lowest median CPA at $27.92, followed by Baby ($29.87), and Books and Music ($30.98).
On the other end, Travel Accessories and Luggage is now the most expensive category to acquire customers through Meta at $52.30, with Electronics close behind at $51.06.
Health and Wellness saw the sharpest CPA increase of any industry, up 10.73% to $42.30, followed by Media and Publishing (+10.05% to $37.53).
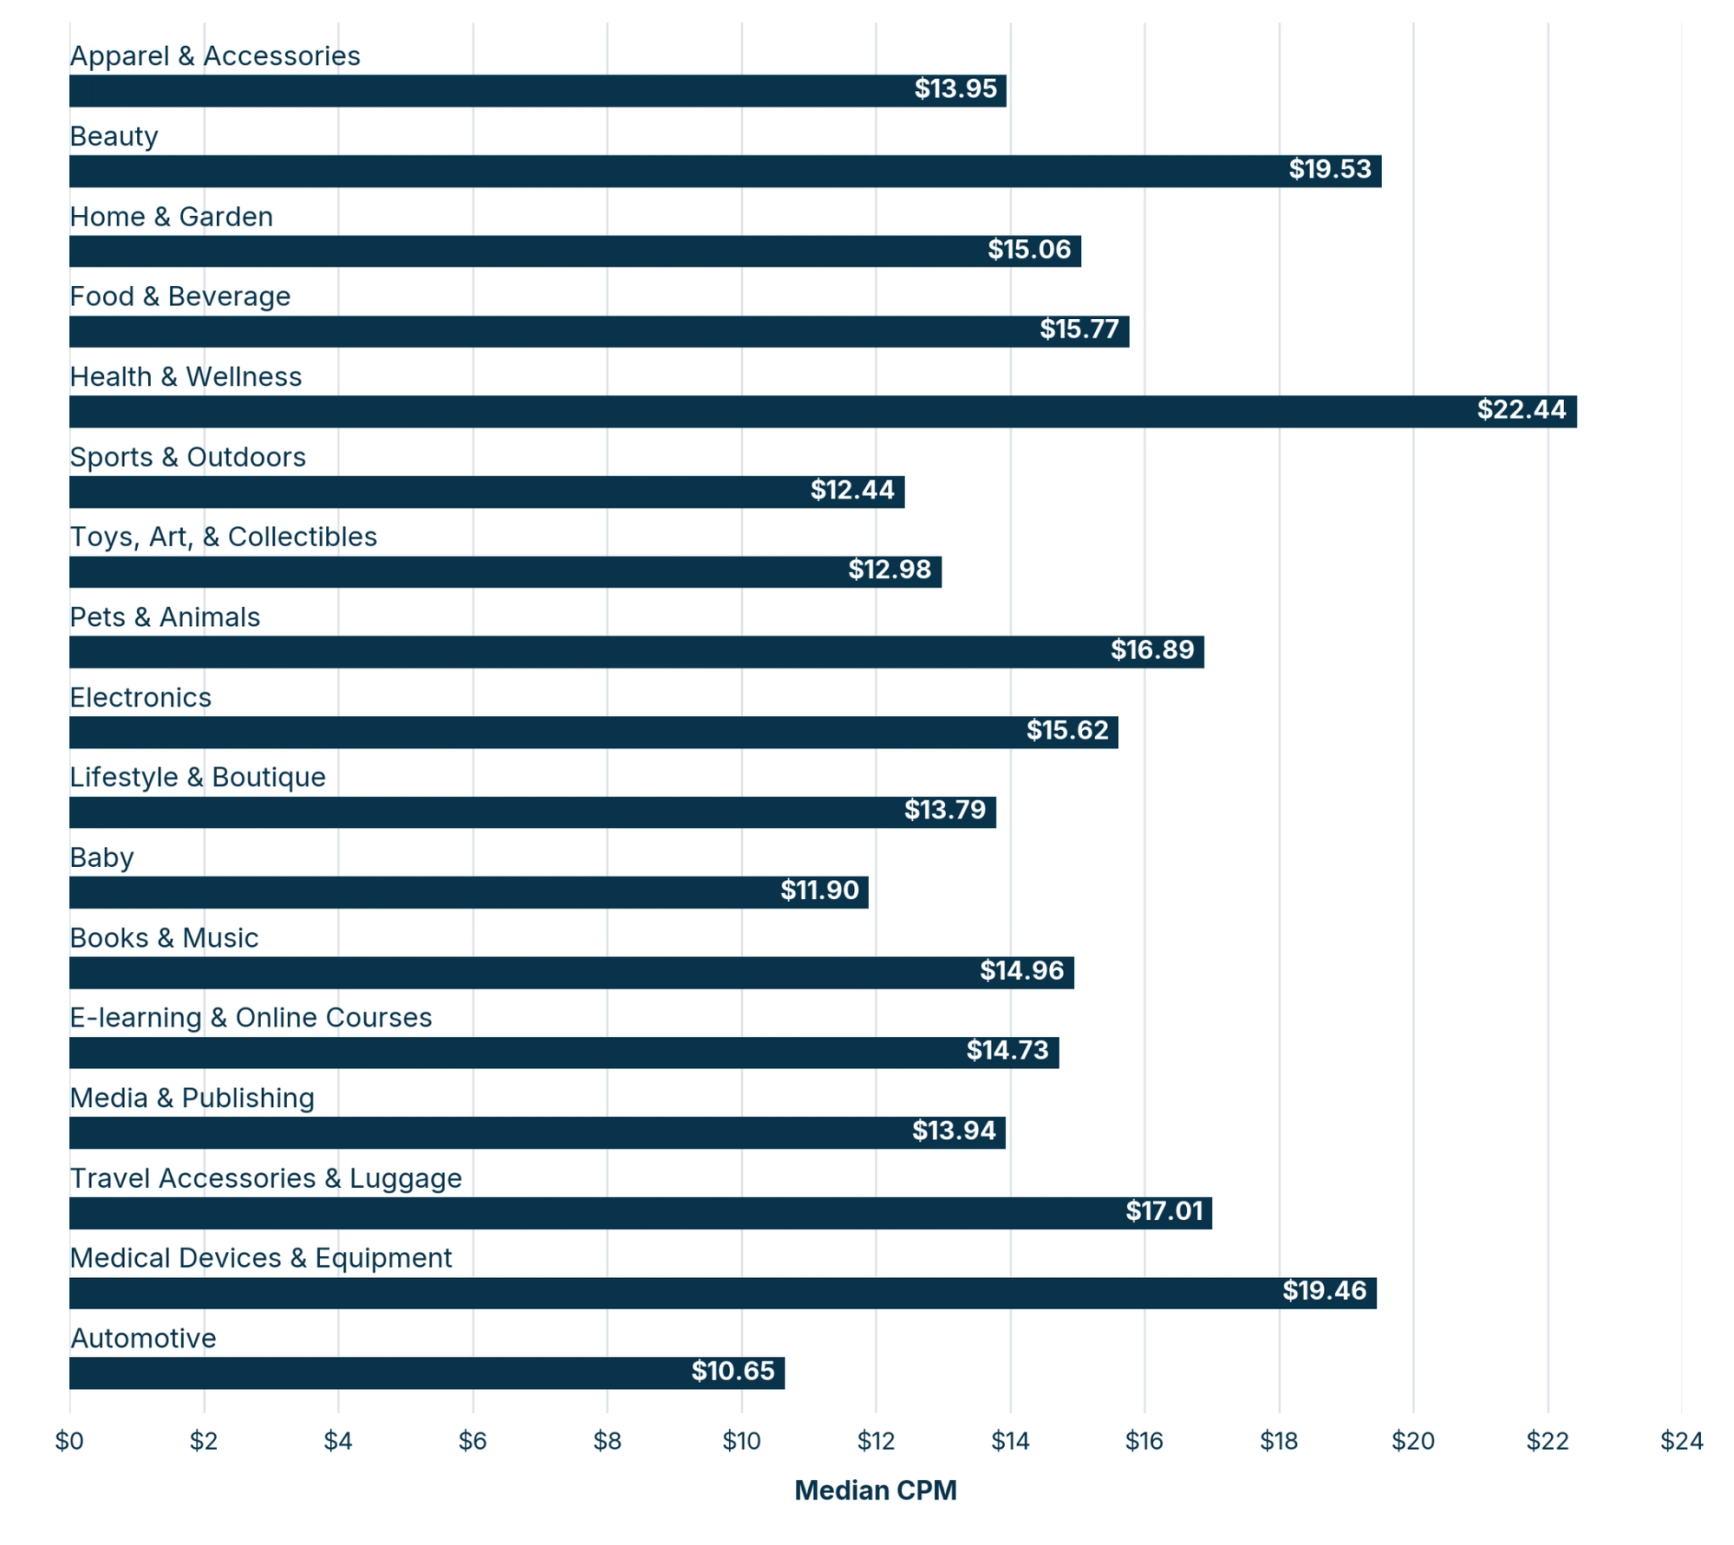
Facebook Ads cost per mille (CPM) by industry
- Apparel and Accessories: $13.95
- Beauty: $19.53
- Home and Garden: $15.06
- Food and Beverage: $15.77
- Health and Wellness: $22.44
- Sports and Outdoors: $12.44
- Toys, Art, and Collectibles: $12.98
- Pets and Animals: $16.89
- Electronics: $15.62
- Lifestyle and Boutique: $13.79
- Baby: $11.90
- Books and Music: $14.96
- E-learning and Online Courses: $14.73
- Media and Publishing: $13.94
- Travel Accessories and Luggage: $17.01
- Medical Devices and Equipment: $19.46
- Automotive: $10.65
Cost per mille (CPM), the cost to reach 1,000 people, reflects how competitive each industry’s auction environment is on Meta. Median CPM rose 13.64% year over year, from $13.83 to $15.72 across all brands, but the increase wasn’t spread evenly.
All seventeen industries saw CPM increase year over year. Changes ranged from +2.06% to +30.7%, showing how differently auction pressure landed across verticals.
Books and Music experienced the most severe CPM inflation at +30.70%, bringing its median to $14.96. Health and Wellness retained the highest median CPM in the dataset at $22.44 after a +14.06% increase.
Electronics (+16.20%) and Medical Devices and Equipment (+23.32%) also posted outsized increases, reflecting growing advertiser interest in previously less contested categories.
On the other end of the spectrum, E-learning and Online Courses (+2.06%), Food and Beverage (+3.54%), and Baby (+3.94%) saw the most contained CPM growth, helping those categories maintain relative cost efficiency as the broader platform got more expensive.
Automotive had the lowest absolute CPM at $10.65 despite a +9.03% increase, proof that even the most affordable category on Meta is not immune to broader auction inflation.
For brands across nearly every vertical, the broad direction of CPM tells a clear story: the cost of awareness on Meta is rising, and strategies that depend on cheap reach alone are under increasing pressure.
Facebook Ads conversion rate (CVR) benchmark by industry
| Industry | Median CVR | % Change YoY |
|---|---|---|
| Apparel and Accessories | 1.49% | +3.00% |
| Beauty | 1.76% | -10.78% |
| Home and Garden | 1.22% | -7.44% |
| Food and Beverage | 1.85% | -9.57% |
| Health and Wellness | 1.43% | -17.51% |
| Sports and Outdoors | 1.27% | +0.36% |
| Toys, Art, and Collectibles | 1.54% | +2.85% |
| Pets and Animals | 1.60% | -12.87% |
| Electronics | 1.16% | -7.97% |
| Lifestyle and Boutique | 1.61% | -8.29% |
| Baby | 1.82% | -3.87% |
| E-Learning and Online Courses | 1.25% | -21.19% |
| Books and Music | 1.74% | +0.67% |
| Media and Publishing | 1.43% | -6.51% |
| Travel Accessories and Luggage | 1.17% | -6.56% |
| Medical Devices and Supplies | 1.11% | +9.37% |
| Automotive | 1.21% | -6.29% |
Conversion rate (CVR) tells you what percentage of users who click on an ad actually convert into customers. Unlike the CPM picture where every industry moved in the same direction, CVR was a mixed bag from November 2025 to October 2026, with gains in some industries and declines in others.
Five of seventeen industries posted year-over-year CVR gains, while twelve declined. Medical Devices and Equipment led all industries with a 9.37% CVR improvement, followed by Apparel and Accessories (+3.00%), and Toys, Art, and Collectibles (+2.85%).
Food and Beverage held its position as the top CVR performer at 1.85%, and Medical Devices and Equipment remains at the bottom of the pack with a CVR of 1.11%.
Facebook Ads click-through (CTR) rate by industry
| Industry | Median CTR | % Change YoY |
|---|---|---|
| Apparel and Accessories | 2.53% | +16.05% |
| Beauty | 2.53% | +15.28% |
| Home and Garden | 2.46% | +13.30% |
| Food and Beverage | 2.05% | +13.13% |
| Health and Wellness | 3.08% | +20.23% |
| Sports and Outdoors | 2.06% | +11.17% |
| Toys, Art, and Collectibles | 2.43% | +14.76% |
| Pets and Animals | 2.44% | +19.09% |
| Electronics | 2.48% | +19.34% |
| Lifestyle and Boutique | 2.54% | +15.03% |
| Baby | 2.05% | +10.55% |
| Books and Music | 2.71% | +23.49% |
| E-learning and Online Courses | 2.81% | +20.70% |
| Media and Publishing | 2.59% | +21.93% |
| Travel Accessories and Luggage | 2.50% | +17.22% |
| Medical Devices and Equipment | 3.12% | +35.82% |
| Automotive | 2.36% | +8.59% |
Click-through rate (CTR) measures how often users who see an ad choose to click it. On Meta, where creative quality has an outsized impact on whether someone stops scrolling, CTR is a strong signal of how well ad content resonates with its target audience.
From November 2025 to October 2026, every industry improved year over year, with increases ranging from +8.59% to +35.82%.
Medical Devices and Equipment saw the biggest jump, with CTR rising +35.82% to 3.12%, the highest of any industry. Books and Music (up 23.49% to 2.71%) and Media and Publishing (up 21.93% to 2.59%) also saw increases.
The Health and Wellness category had the second-highest CTR (3.08%), which may point to how aggressively the category has leaned into Meta’s video and Reels formats to capture attention.
A universal CTR improvement should be considered alongside CVR data. For example, a category like Electronics saw a CTR increase of +19.34% while CVR fell by -7.97%, meaning ads are generating more clicks, but those clicks are converting less. This is a warning sign that post-click friction or offer quality may be a growing issue.
On the other hand, Food and Beverage and Baby tied for the lowest CTR at 2.05% but had the two highest CVRs at 1.85% and 1.82%, indicating that click volume and purchase intent aren’t necessarily the same thing.
Facebook Ads return on ad spend (ROAS) by industry
| Industry | Median ROAS | % Change YoY |
|---|---|---|
| Apparel and Accessories | 2.26 | +5.36% |
| Beauty | 1.53 | -3.14% |
| Home and Garden | 2.29 | +6.48% |
| Food and Beverage | 1.61 | +5.61% |
| Health and Wellness | 1.42 | -5.54% |
| Sports and Outdoors | 2.38 | +5.80% |
| Toys, Art, and Collectibles | 1.99 | +4.65% |
| Pets and Animals | 1.58 | +1.05% |
| Electronics | 1.98 | +3.19% |
| Lifestyle and Boutique | 2.07 | +9.20% |
| Baby | 2.27 | +5.73% |
| Books and Music | 1.64 | +1.93% |
| E-learning and Online Courses | 1.21 | +3.11% |
| Media and Publishing | 1.09 | -6.35% |
| Travel Accessories and Luggage | 2.21 | -1.03% |
| Medical Devices and Equipment | 1.69 | +10.34% |
| Automotive | 2.75 | +9.97% |
Return on ad spend (ROAS) is the most direct measure of advertising efficiency, as it measures how much revenue is returned for every dollar spent on ads.
From November 2025 to October 2026, ROAS was one of Meta’s brighter stories at the industry level: thirteen of seventeen verticals posted year-over-year improvements, a notably different picture from the broad CPM increases recorded across the same period.
Medical Devices and Equipment (+10.34% to 1.69) and Automotive (+9.97% to 2.75) posted the largest gains, followed by Lifestyle and Boutique (+9.20% to 2.07).
Automotive had the top position at 2.75, with Sports and Outdoors (2.38) and Home and Garden (2.29) rounding out the leaders.
Media and Publishing had the lowest ROAS at 1.09, one of three industries below 1.5. With an AOV of $49.60, the margin between revenue and ad spend is razor-thin, leaving virtually no room for error.
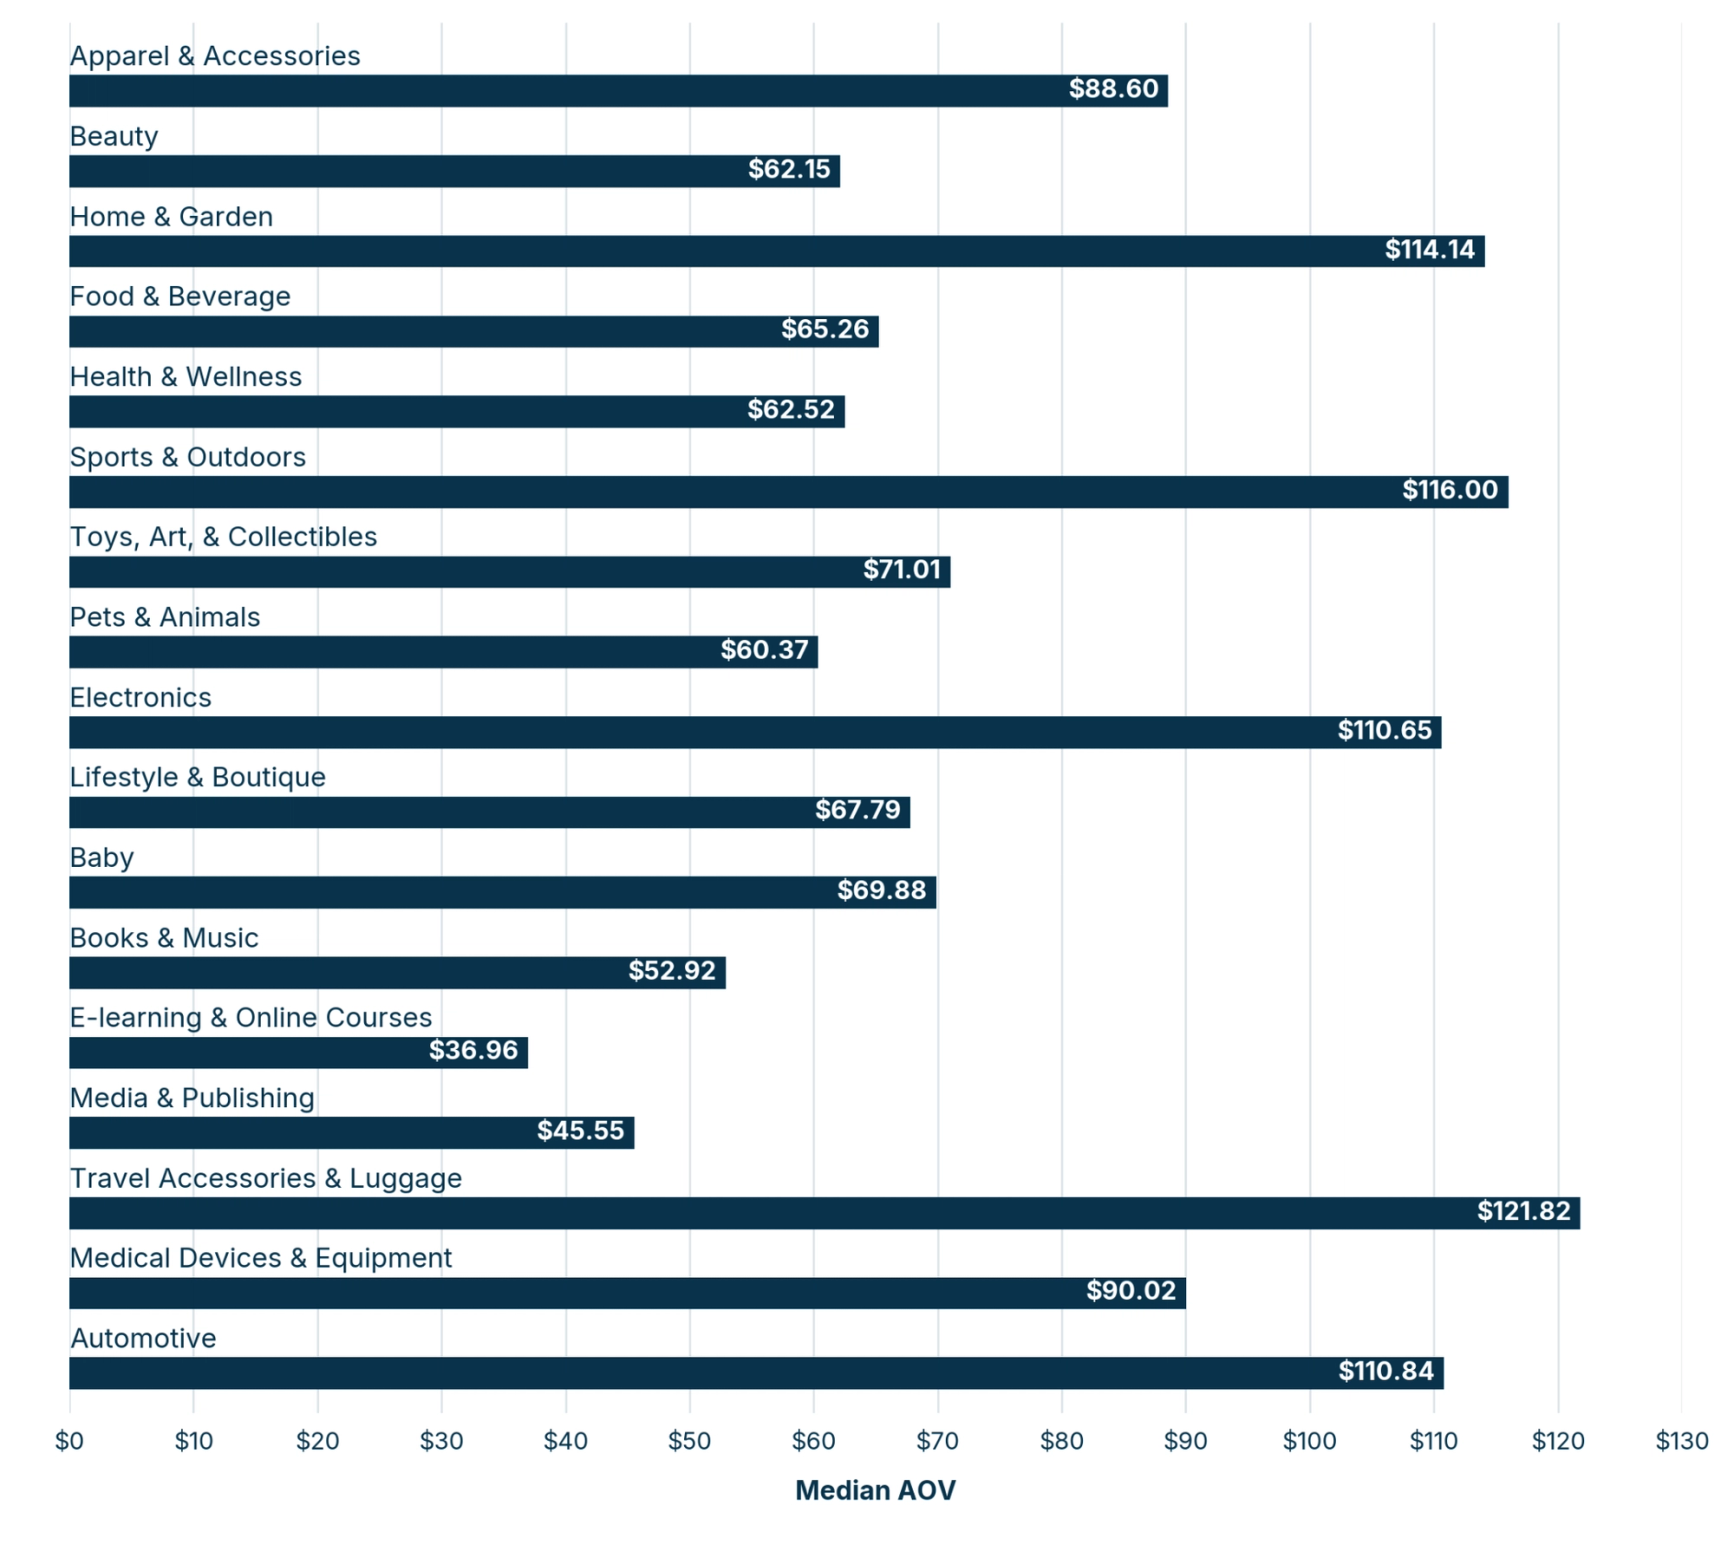
Facebook Ads average order value (AOV) by industry
- Apparel and Accessories: $88.60
- Beauty: $62.15
- Home and Garden: $114.14
- Food and Beverage: $65.26
- Health and Wellness: $62.52
- Sports and Outdoors: $116.00
- Toys, Art, and Collectibles: $71.01
- Pets and Animals: $60.37
- Electronics: $110.65
- Lifestyle and Boutique: $67.79
- Baby: $69.88
- Books and Music: $52.92
- E-learning and Online Courses: $36.96
- Media and Publishing: $45.55
- Travel Accessories and Luggage: $121.81
- Medical Devices and Equipment: $90.02
- Automotive: $110.84
Average order value (AOV) reflects the average dollar value of each order driven through Meta ads and is critical to determining whether a category’s unit economics can sustain Meta’s cost structure. Unlike CPM, which trended broadly higher from November 2025 to October 2026, AOV across most industries moved in brands’ favor, with larger orders helping to offset the rising cost of reaching shoppers.
All seventeen industries improved AOV year-over-year. Lifestyle and Boutique led with the largest gain, up 15% to $67.79.
E-learning and Online Courses (+13.20% to $36.96), Home and Garden (+13.14% to $114.14), and Automotive (+11.37% to $110.84) also had strong AOV growth.
Medical Devices and Equipment (+0.02% to $90.02) had one of the smallest gains in the dataset. Travel Accessories and Luggage remained the highest-AOV category at $121.82, although its +1.62% year-over-year increase was the second smallest.
Facebook Ads marketing efficiency ratio (MER) by industry
| Industry | Median MER | % Change YoY |
|---|---|---|
| Apparel and Accessories | 0.41 | -4.03% |
| Beauty | 0.61 | +3.79% |
| Home and Garden | 0.38 | -5.17% |
| Food and Beverage | 0.56 | -4.61% |
| Health and Wellness | 0.62 | +4.44% |
| Sports and Outdoors | 0.37 | -6.09% |
| Toys, Art, and Collectibles | 0.47 | -2.81% |
| Pets and Animals | 0.59 | -1.33% |
| Electronics | 0.46 | -2.61% |
| Lifestyle and Boutique | 0.45 | -8.49% |
| Baby | 0.42 | -2.74% |
| Books and Music | 0.59 | -1.16% |
| E-learning and Online Courses | 0.66 | -7.82% |
| Media and Publishing | 0.77 | +5.40% |
| Travel Accessories and Luggage | 0.41 | +2.02% |
| Medical Devices and Equipment | 0.53 | -0.86% |
| Automotive | 0.31 | -11.93% |
Marketing efficiency ratio (MER) indicates how many dollars in revenue your brand generates for each dollar of paid media, calculated by dividing total revenue by total ad spend. This differs from ROAS, which divides total revenue generated from ads by ad spend.
MER tells a mixed story for November 2025 to October 2026: thirteen of seventeen industries saw their ratio decline year over year, meaning those verticals generated less revenue relative to their Meta ad spend than the prior year.
Media and Publishing posted the highest MER at 0.77 and was one of the few industries to see an increase (+5.40%). Health and Wellness (+4.44% to 0.62), and Beauty (+3.79% to 0.61) also saw a MER increase.
Automotive had the sharpest MER drop, down 11.93% to 0.31, and Lifestyle and Boutique (-8.49% to 0.45), E-learning and Online Courses (-7.82% to 0.66), and Sports and Outdoors (-6.09% to 0.37) also posted notable declines.
For brands interpreting these numbers, a declining MER prompts an examination of whether rising CPMs are quietly compressing returns, even in categories that appear healthy on other metrics.
Conclusion
These Meta benchmarks provide a crucial reference for brands evaluating their ad strategies in the year ahead. Use them to contextualize your performance, identify where there is room to improve, and set targets grounded in what the platform is actually delivering across your industry.
Ready to jump right in? Triple Whale gives you full-funnel visibility into your marketing performance so you can shift spend, allocate budget, and get benchmarks at your fingertips. Get started for free today.
Facebook Ads: FAQs
What is a good ROAS for Facebook ads?
From November 2025 to October 2026, brands on Meta using Triple Whale earned a median of $1.88 in ad-attributed revenue for every $1 spent. But that number shifts by industry: Automotive had the highest median at 2.75, while Media and Publishing had the lowest at 1.09.
What is a good CTR for Facebook ads?
The median CTR for Triple Whale brands was 2.48%, up 17.22% from the year before. By industry, Medical Devices and Equipment had the highest median at 3.12%, while Food and Beverage and Baby had the lowest at 2.05%.
What is the average CPM on Facebook and Instagram?
The typical CPM across Facebook and Instagram was $15.72 from November 2025 to October 2026. That’s the median for more than 41,000 Triple Whale brands running Meta ads. It’s up 13.64% from $13.83 the year before.