


Most ecommerce brands respond to declining ad performance the same way: they replace the entire creative and hope the next one works. This is expensive, slow, and throws away everything the previous ad taught you.
The smarter approach is diagnosis before action. When you understand which metrics correspond to which component failures, you can see exactly where the breakdown is occurring and fix only what's broken. An ad with a failing hook but a strong message might only need a new opening frame. Replacing the entire creative wastes your learning and resets the delivery algorithm's optimization.
This guide breaks down the five components of a high-performing ad, maps specific metric patterns to specific failure modes, and gives you a diagnostic reference you can return to every time performance declines.
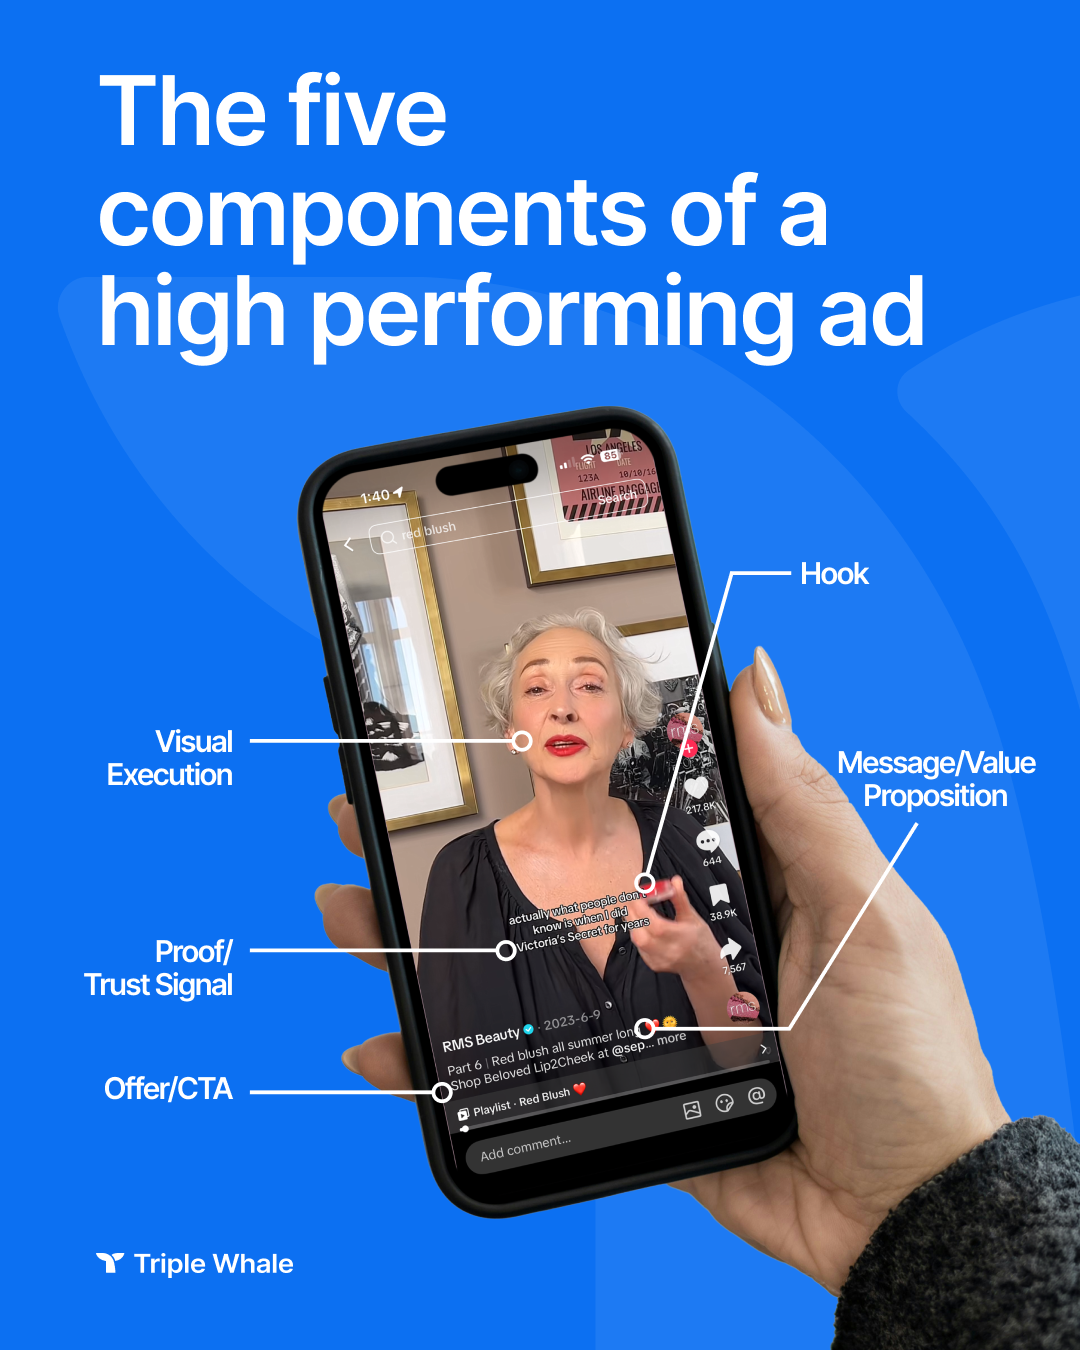
Every ecommerce ad, whether static or video, can be broken down into five functional components. Each one does a distinct job, and each one fails in a recognizable way.
This is the first 2–3 seconds of a video or the headline of a static ad. Its only job is to stop the scroll and generate curiosity. When the hook fails, you see low hook rates, high CPM, and low CTR. The ad simply isn't earning attention in the feed.
This is the core claim: why the product solves the problem. It needs to be specific enough to be credible and relevant to the viewer. When the message fails, you typically see high CTR paired with low CVR: the hook did its job, but the substance of the ad didn't persuade anyone to convert. This pattern often indicates that the promise doesn't match what the viewer finds on the landing page, or that the message is too generic to feel relevant.
This covers the quality, style, and format of the creative itself: video production, imagery, motion, graphic treatment. Visual execution fails when the ad looks like an ad in an environment where native content performs better, or when the aesthetic simply no longer feels fresh. You'll see engagement rate drop while hook rate holds steady: people are stopping, but they're not staying.
Testimonials, review counts, social proof, and endorsements address the viewer's question: "Should I believe this?" Trust signals fail when they're absent, generic, or not matched to the specific persona's concerns. The metric signature is high CTR and initial engagement, but CVR drops at the bottom of the funnel. People are interested, but not convinced.
This is the specific action you're asking the viewer to take, plus the incentive attached to it. The offer fails when it's not competitive relative to alternatives, or when the CTA creates unnecessary friction. You'll see add-to-cart rates fall or ROAS drop while CVR holds — people are buying, but not at the margin you need.
The real power of this framework is in the pattern matching. Each combination of metric movements points to a different root cause, and therefore a different fix.
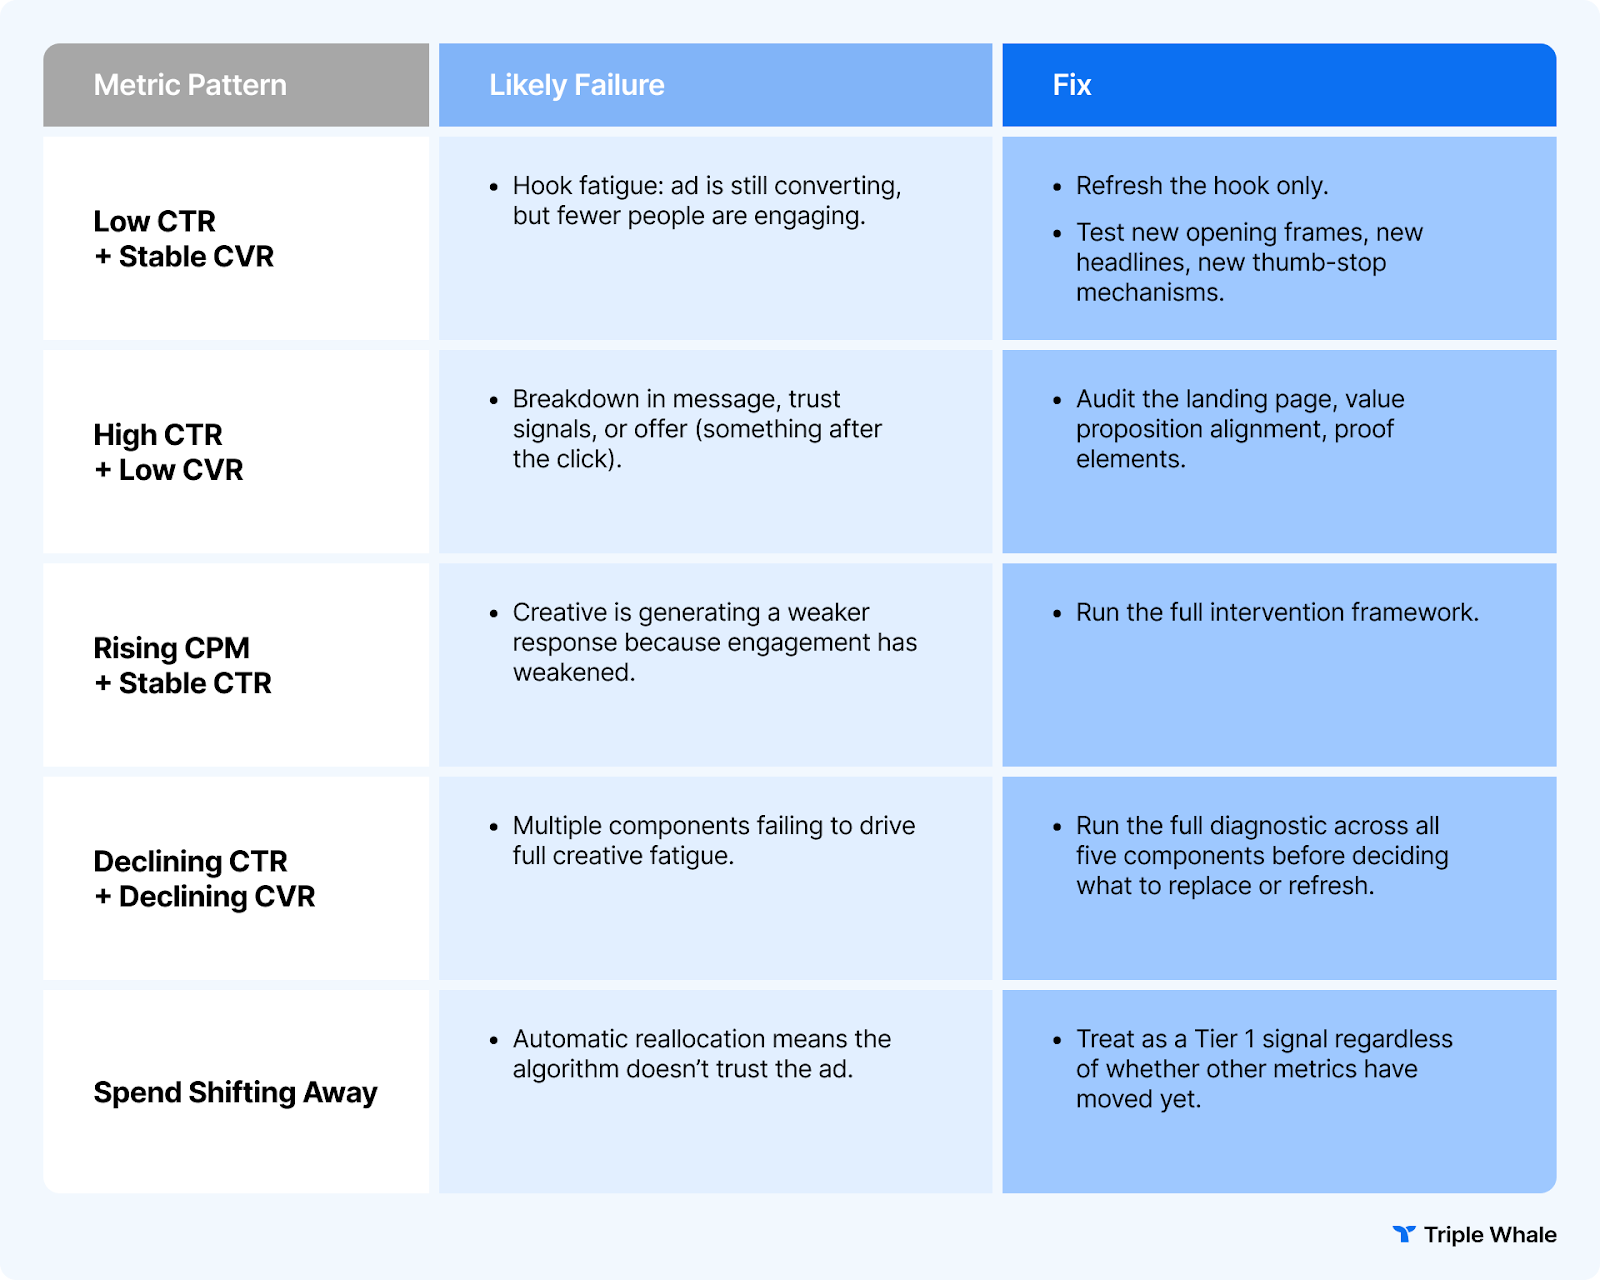
The ad is still converting people who engage with it, but fewer people are engaging in the first place. The hook has lost its stopping power. The fix is targeted: refresh the hook only. Test new opening frames, new headlines, new thumb-stop mechanisms. Keep the body of the ad intact — it's still working.
This is one of the most common and most treatable failure modes. The key diagnostic question is: where is the friction taking place? If you follow the metrics down the funnel and the breakdown happens at the very top, change only the top. Don't touch what's working downstream.
People are clicking, but they're not buying, so something after the click is failing. This could be a mismatch between the ad's promise and the landing page experience, weak or missing proof elements, or an offer that doesn't close. The fix requires auditing the post-click experience: the landing page, value proposition alignment, and proof elements.
This pattern is one of the most critical to diagnose correctly. When CTR is stable but CVR collapses, the issue can often be traced back to the ad promise, the landing page, or the proof elements. A high CTR paired with low conversion often means the creative is either misleading or attracting traffic that the landing page can't close.
The creative is still generating clicks at a consistent rate, but the platform is charging more for impressions. This means Meta's system is detecting a weaker overall engagement response — the ad is generating less signal value per impression even though click behavior hasn't changed yet. Rising CPM with flat CTR is an early-stage warning that often precedes broader decline. Run the full intervention framework when you see this pattern.
Sudden CPM jumps without corresponding improvements in traffic quality or conversion volume typically signal one of three things — audience overlap, weak creative testing, or too many learning phase resets.
When both attention and conversion are deteriorating simultaneously, you're dealing with full creative fatigue. No single component fix will solve it. Run the full diagnostic across all five components before deciding what to replace or refresh. This is a Tier 2 or Tier 3 intervention scenario — the ad needs significant structural change.
In automated campaign setups, Meta deprioritizes budget allocation to creatives it no longer trusts. If a previously strong ad is losing budget share within its campaign without any manual change, the algorithm is telling you something — even if the surface metrics haven't moved dramatically yet. Treat this as a Tier 1 signal regardless of what other metrics show.
The diagnostic matrix isn't meant to be applied once and forgotten. It should be the first step in every creative review, every time an ad is flagged for declining performance.
The process is simple. First, pull the 7-day and 30-day performance data for any ad that's been flagged. Second, identify which metric pattern matches what you're seeing. Third, map that pattern to the component that's failing. Fourth, prescribe a fix that targets only the broken component.
The instinct when performance drops is to scrap everything and start over. But if the hook is the only thing that's fatigued, a full creative rebuild wastes the validated message, the proven proof elements, and the algorithm's accumulated learning. Fix what's broken and keep what’s working. If you change too many variables at once, it is difficult to understand which part was actually broken. It’s more effective to identify the bottleneck, change only that variable, and let the data confirm whether you were right.
Beyond the metric-level diagnosis, most creative failures across ecommerce accounts follow a handful of recognizable patterns:
Replacing an ad without diagnosing it is like prescribing medicine without a diagnosis. You might get lucky, but you're more likely to waste time and money while the real problem persists.
Build the diagnostic step into your weekly creative review. Map the metric signature to the failure mode. Fix the component that's actually broken. Over time, this discipline compounds — you learn faster, waste less, and build a creative operation that improves with every cycle.
Most ecommerce brands respond to declining ad performance the same way: they replace the entire creative and hope the next one works. This is expensive, slow, and throws away everything the previous ad taught you.
The smarter approach is diagnosis before action. When you understand which metrics correspond to which component failures, you can see exactly where the breakdown is occurring and fix only what's broken. An ad with a failing hook but a strong message might only need a new opening frame. Replacing the entire creative wastes your learning and resets the delivery algorithm's optimization.
This guide breaks down the five components of a high-performing ad, maps specific metric patterns to specific failure modes, and gives you a diagnostic reference you can return to every time performance declines.
Every ecommerce ad, whether static or video, can be broken down into five functional components. Each one does a distinct job, and each one fails in a recognizable way.
This is the first 2–3 seconds of a video or the headline of a static ad. Its only job is to stop the scroll and generate curiosity. When the hook fails, you see low hook rates, high CPM, and low CTR. The ad simply isn't earning attention in the feed.
This is the core claim: why the product solves the problem. It needs to be specific enough to be credible and relevant to the viewer. When the message fails, you typically see high CTR paired with low CVR: the hook did its job, but the substance of the ad didn't persuade anyone to convert. This pattern often indicates that the promise doesn't match what the viewer finds on the landing page, or that the message is too generic to feel relevant.
This covers the quality, style, and format of the creative itself: video production, imagery, motion, graphic treatment. Visual execution fails when the ad looks like an ad in an environment where native content performs better, or when the aesthetic simply no longer feels fresh. You'll see engagement rate drop while hook rate holds steady: people are stopping, but they're not staying.
Testimonials, review counts, social proof, and endorsements address the viewer's question: "Should I believe this?" Trust signals fail when they're absent, generic, or not matched to the specific persona's concerns. The metric signature is high CTR and initial engagement, but CVR drops at the bottom of the funnel. People are interested, but not convinced.
This is the specific action you're asking the viewer to take, plus the incentive attached to it. The offer fails when it's not competitive relative to alternatives, or when the CTA creates unnecessary friction. You'll see add-to-cart rates fall or ROAS drop while CVR holds — people are buying, but not at the margin you need.
The real power of this framework is in the pattern matching. Each combination of metric movements points to a different root cause, and therefore a different fix.
The ad is still converting people who engage with it, but fewer people are engaging in the first place. The hook has lost its stopping power. The fix is targeted: refresh the hook only. Test new opening frames, new headlines, new thumb-stop mechanisms. Keep the body of the ad intact — it's still working.
This is one of the most common and most treatable failure modes. The key diagnostic question is: where is the friction taking place? If you follow the metrics down the funnel and the breakdown happens at the very top, change only the top. Don't touch what's working downstream.
People are clicking, but they're not buying, so something after the click is failing. This could be a mismatch between the ad's promise and the landing page experience, weak or missing proof elements, or an offer that doesn't close. The fix requires auditing the post-click experience: the landing page, value proposition alignment, and proof elements.
This pattern is one of the most critical to diagnose correctly. When CTR is stable but CVR collapses, the issue can often be traced back to the ad promise, the landing page, or the proof elements. A high CTR paired with low conversion often means the creative is either misleading or attracting traffic that the landing page can't close.
The creative is still generating clicks at a consistent rate, but the platform is charging more for impressions. This means Meta's system is detecting a weaker overall engagement response — the ad is generating less signal value per impression even though click behavior hasn't changed yet. Rising CPM with flat CTR is an early-stage warning that often precedes broader decline. Run the full intervention framework when you see this pattern.
Sudden CPM jumps without corresponding improvements in traffic quality or conversion volume typically signal one of three things — audience overlap, weak creative testing, or too many learning phase resets.
When both attention and conversion are deteriorating simultaneously, you're dealing with full creative fatigue. No single component fix will solve it. Run the full diagnostic across all five components before deciding what to replace or refresh. This is a Tier 2 or Tier 3 intervention scenario — the ad needs significant structural change.
In automated campaign setups, Meta deprioritizes budget allocation to creatives it no longer trusts. If a previously strong ad is losing budget share within its campaign without any manual change, the algorithm is telling you something — even if the surface metrics haven't moved dramatically yet. Treat this as a Tier 1 signal regardless of what other metrics show.
The diagnostic matrix isn't meant to be applied once and forgotten. It should be the first step in every creative review, every time an ad is flagged for declining performance.
The process is simple. First, pull the 7-day and 30-day performance data for any ad that's been flagged. Second, identify which metric pattern matches what you're seeing. Third, map that pattern to the component that's failing. Fourth, prescribe a fix that targets only the broken component.
The instinct when performance drops is to scrap everything and start over. But if the hook is the only thing that's fatigued, a full creative rebuild wastes the validated message, the proven proof elements, and the algorithm's accumulated learning. Fix what's broken and keep what’s working. If you change too many variables at once, it is difficult to understand which part was actually broken. It’s more effective to identify the bottleneck, change only that variable, and let the data confirm whether you were right.
Beyond the metric-level diagnosis, most creative failures across ecommerce accounts follow a handful of recognizable patterns:
Replacing an ad without diagnosing it is like prescribing medicine without a diagnosis. You might get lucky, but you're more likely to waste time and money while the real problem persists.
Build the diagnostic step into your weekly creative review. Map the metric signature to the failure mode. Fix the component that's actually broken. Over time, this discipline compounds — you learn faster, waste less, and build a creative operation that improves with every cycle.

A diagnostic guide that maps specific ad metric patterns (low CTR + stable CVR, high CTR + low CVR, etc.) to specific creative component failures (hook, message, trust, offer, visual), so brands can fix only what's broken rather than replacing entire ads.

Body Copy: The following benchmarks compare advertising metrics from April 1-17 to the previous period. Considering President Trump first unveiled his tariffs on April 2, the timing corresponds with potential changes in advertising behavior among ecommerce brands (though it isn’t necessarily correlated).


.webp)

.webp)


.png)


.png)
.png)
.png)