


Every marketer tracks (and should track) CPA. It shows up in dashboards, anchors campaign reviews, and drives budget conversations with leadership. But, here’s the thing: most teams are calculating it wrong.
Teams might divide ad spend by conversions and call it a day, only left to wonder why their profitable-looking campaigns somehow aren’t moving the bottom line. The disconnect usually comes down to incomplete cost accounting, mismatched attribution, or treating CPA like it’s a standalone metric instead of connecting it to what a customer is actually worth over time.
This guide breaks down what cost per acquisition actually is, how to calculate it completely, how it compares to related metrics like CAC and CPL, and how to use it as a strategic tool for profitable growth.
Whether you’re running paid social for a DTC brand or managing multi-channel programs for a SaaS company, this is the CPA resource you’ll keep coming back to.
Key takeaways
Cost per acquisition (CPA) is a marketing metric that measures the total cost of acquiring a single customer or conversion through a specific campaign or channel.
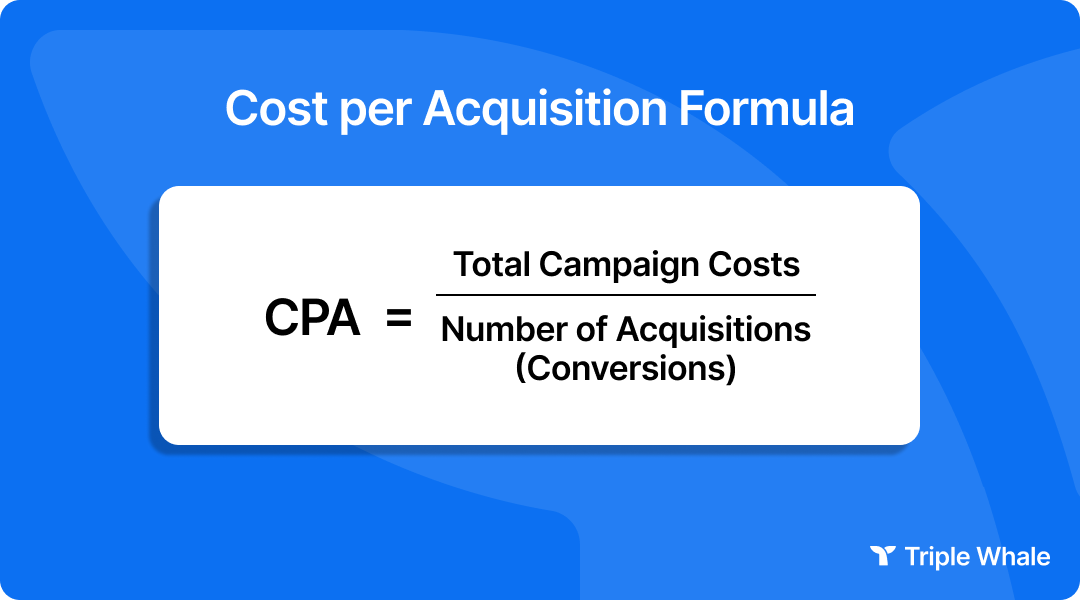
The formula is simple: divide the total campaign costs by the number of conversions. But the most important word in that definition is total. CPA should reflect every dollar that contributed to generating that conversion, not just the ad spend.
What counts as an “acquisition” depends on your business model. For ecommerce, it typically means a completed purchase. For SaaS, it could be a trial signup or a paid subscription. For a lead-gen business, it might be a qualified lead or a closed deal. Getting this definition right before you calculate anything is crucial, because a vague conversion event produces a meaningless CPA.
CPA functions as an efficiency ratio. It tells you how much revenue-generating activity each marketing dollar is producing. That is why it matters beyond basic cost tracking. When CPA is accurate and consistently measured, it becomes the common language between marketing, finance, and leadership for evaluating campaign performance.
CPA gives you a single, comparable number to evaluate campaign efficiency across channels, audiences, and time periods. Without it, you’re stuck comparing apples to oranges: clicks in one report, impressions in another, and no clear way to tell which campaign is actually driving profitable growth.
CPA also directly supports budget justification. When you can tell leadership that a campaign produced 200 customers at a CPA of $45 against a customer lifetime value (LTV) of $180, you are speaking in terms that resonate with finance teams. Return on investment and profitable economics will help get those budgets approved.
That said, CPA is most useful when evaluated relative to profit margins on customer lifetime value. A $50 CPA is excellent for a brand with $200 average order values and 60% margins. It is terrible for a brand with $70 AOVs and 30% margins. This detail will be investigated further in the LTV:CPA section to come.
CPA is used across paid search, paid social, affiliate marketing, email, and content marketing, but the way it is calculated and interpreted differs by channel. In paid search, CPA is typically straightforward because conversion tracking ties directly to ad clicks. In content marketing, CPA requires a longer measurement window because the investment in content production is spread across many conversions over time.
One important distinction: in Google Ads, “target CPA” refers to an automated bid strategy that uses machine learning to optimize bids toward a specified cost per conversion. That is a related but distinct use of the term from the analytical metrics covered in this article. When someone references CPA in a strategic planning context, they are talking about the measured cost of acquiring a customer, not a bid setting.
The standard formula is:
An alternative version uses cost per click and conversion rate: CPA = CPC Conversion Rate. This is useful when you know your media buying costs and landing page conversion rate but do not have a campaign-level cost total readily available.
This is where most CPA calculations fall apart. Too many teams only count ad spend, which produces an artificially low CPA that overstates campaign profitability. A true CPA calculation should include every cost that contributed to generating those conversions:
Underreporting costs by only counting ad spend is the most common mistake in CPA calculation. It makes campaigns look more profitable than they are, which leads to poor budget allocation decisions downstream. Audit your cost inputs before you trust your CPA number.
Here’s a realistic ecommerce CPA calculation:
Scenario: A DTC skincare brand runs a Q1 acquisition campaign across Meta and Google.
If this brand had only counted the $20,000 spent on ads, the CPA would appear to be $50, understating the true cost by 29%. That gap matters when you are making decisions about whether to scale the campaign.
Marketers frequently conflate CPA with CAC, CPL, and CPC. Using the wrong metric for the wrong decision leads to misaligned optimization efforts. Here is a clear disambiguation:
CAC is a broader business metric. It typically includes all sales and marketing costs across a time period, including salaries, software, overhead, and every channel, divided by the total number of new customers acquired. CPA, by contrast, is campaign-specific and tied to a defined conversion event.
CPA and CAC can be equal in simple business models where a single campaign drives all acquisition. But they diverge significantly in businesses with long sales cycles, multiple touchpoints, or blended channel spend.
CPL measures the cost to generate a lead, which is a top-of-funnel action. CPA measures the cost to complete an acquisition, a downstream conversion event. For lead-gen businesses, both are necessary: CPL tracks pipeline efficiency, while CPA tracks revenue efficiency. A brand with a $10 CPL and a 10% lead-to-customer conversion rate has a $100 CPA from that channel.
CPC is a media buying metric that measures the cost of driving traffic, not conversions. It sits earlier in the funnel than CPA and does not account for what happens after the click. A low CPC does not guarantee a low CPA. If your landing page conversion rate is poor, high click volume can produce a very high CPA despite efficient media buying. The relationship is direct: CPA = CPC Conversion Rate.
ROAS (return on ad spend) measures revenue generated per dollar of ad spend, while CPA measures the cost to generate a single conversion. They answer different questions and should be used together, not interchangeably. A campaign with a $40 CPA and a $200 average order value produces a 5:1 ROAS, which sounds excellent. But if that campaign only counted ad spend and the true all-in CPA is $80, the picture changes.
ROI goes further than both CPA and ROAS by incorporating profit margins and total costs, making it the most complete measure of business performance. Smart teams track all three: CPA for campaign-level efficiency, ROAS for revenue generation, and ROI for profitability.
There is no universal “good” CPA. The right number depends on your profit margins, average order value, and customer lifetime value. A $100 CPA is fantastic for a brand selling $500 products with 70% margins. That same CPA is a death sentence for a brand selling $80 products with 25% margins.
The LTV:CPA ratio is the most practical tool for evaluating whether a CPA is acceptable. The widely used benchmark is 3:1: if customer lifetime value is three times the cost per acquisition, the acquisition is generally profitable after accounting for cost of goods sold (COGS), fulfillment, customer service, and overhead.
The logic behind 3:1 is straightforward. If your LTV is $150 and your CPA is $50, you have $100 of remaining revenue to cover product costs, operations, and profit. At a 3:1 ratio, most business models can sustain healthy margins. Below that, things get tight.
How profit margins and AOV affect your target CPA
Two businesses with the same CPA can have very different profitability outcomes depending on their unit economics.
Example: Both Brand A and Brand B have a $50 CPA:
Brand A is highly profitable at a $50 CPA. Brand B is losing money on every acquisition. The takeaway: target CPA should always be calculated backward from margin and LTV, not benchmarked against competitors or industry averages in isolation.
The following benchmarks are based on aggregated Triple Whale data from over 40,000 ecommerce ad accounts and $21 billion in ad spend over the trailing 12 months. These are median CPA figures. Industries with fewer than 100 ad accounts or under $1 million in total ad spend have been excluded.
Median CPAs across ecommerce industries range from roughly $26 to $50. The two largest categories by spend — Apparel & Accessories and Health & Beauty — both land right around $31, which makes that figure a reasonable baseline for DTC brands evaluating their own performance. Higher ticket verticals like Home & Garden, Electronics, and Travel Accessories & Luggage naturally sit higher in the $40-$43 range, while lower-AOV categories like Books, Baby, and Food & Beverage tend to cluster under $30.
CPA is not a single number across a marketing program. It varies significantly by channel because each channel reaches different audiences at different stages of the funnel with different intent levels. Cross-channel CPA comparison requires consistent conversion tracking and a shared attribution framework.
Paid search typically produces lower CPA for high-intent queries because users are actively searching for a solution. But competitive keywords drive up cost per click (CPC), which can erode CPA efficiency.
Quality Score, negative keywords, and bid strategy are the primary levers for managing CPA in Google Ads. Campaigns targeting branded keywords will almost always have a lower CPA than non-branded campaigns, which is important to separate when evaluating performance.
Paid social reaches users who are not actively searching, so CPA tends to be higher for cold audiences. But it can be reduced significantly through audience segmentation and retargeting. Ad creative quality has an outsized impact on CPA in paid social compared to other channels. A strong creative can reduce CPA by improving both click-through rate (CTR) and post-click conversion rate simultaneously. Creative fatigue is real, here: When a winning ad starts to plateau, CPA creeps up, and Teams need a structured testing cadence to stay ahead.
Affiliate is a performance-based channel where CPA is often fixed by contract: the advertiser pays a set commission per acquisition. This makes CPA predictable, but it requires careful margin management. Affiliate CPA can also appear artificially low if attribution is not properly configured, since affiliates may receive credit for conversions that would have occurred organically.
Content marketing has a delayed and distributed CPA. The upfront investment in content production and optimization is spread across many conversions over time, making CPA calculation require a longer measurement window. The advantage is that SEO CPA tends to decrease over time as content compounds. That is a key structural advantage over paid channels, where CPA is directly tied to ongoing spend.
Email marketing typically produces the lowest CPA of any channel because it targets an existing audience with established brand familiarity. But this efficiency depends on list quality and segmentation. Teams should still account for platform costs, content production, and list management overhead to avoid understating the true cost. Email CPA can also be misleading if it is credited with conversions that were already in progress through other channels.
Attribution is one of the most significant operational challenges in CPA measurement. When a customer interacts with multiple touchpoints before converting, assigning the full acquisition cost to a single channel produces a distorted CPA.
Last-click attribution, which many platforms default to, gives all conversion credit to the final touchpoint. This overvalues bottom-of-funnel channels (branded search, retargeting) and undervalues the awareness and consideration channels (paid social, content) that initiated the customer journey. The result: marketers underinvest in top-of-funnel activity because its CPA looks inflated, and overinvest in retargeting because its CPA looks artificially low.
Multi-touch attribution (MTA) models distribute credit across multiple touchpoints, which produces a more accurate CPA per channel. Linear attribution splits credit equally. Time-decay models give more credit to recent touchpoints. Position-based models weight the first and last interactions more heavily. Each approach has tradeoffs, and none is perfectly objective.
The practical reality is that MTA models require robust infrastructure and consistent tracking across channels. They are more accurate than last-click, but they are also more complex to implement and maintain. The key takeaway for CPA measurement: understand which attribution model your CPA numbers are based on, and factor that context into every optimization decision.
Before optimizing CPA, you need to understand which variables are driving it up or down. Some are within your control, and others are not.
Not all CPA optimization tactics are equal. Some are high-impact but resource-intensive. Others are quick wins. The table below ranks the most common optimization levers by estimated impact, time to implement, and resource requirements.
Landing page CRO is typically the highest-leverage CPA reduction tactic because it improves the efficiency of every dollar already being spent. If your conversion rate goes from 3% to 4%, your CPA drops by 25% across the entire campaign without changing a single ad setting.
Start with A/B testing headlines and calls to action. Reduce form friction by removing unnecessary fields. Align landing page messaging with ad copy so visitors get a consistent experience from click to conversion. And do not overlook page load speed, which directly impacts both conversion rate and ad platform quality scores.
Tighter audience segmentation reduces wasted spend on users unlikely to convert. Build lookalike audiences from high-LTV customers, not just any customers. Exclude existing customers from acquisition campaigns to avoid paying to reach people you have already acquired. Use behavioral and intent signals to qualify audiences before they enter your funnel.
One caution: over-narrowing audiences can reduce scale and actually increase CPA by limiting the algorithm’s ability to optimize delivery. There is a targeting precision vs. reach tradeoff to manage.
In paid social especially, creative quality directly affects both CTR and ad relevance scores, which in turn affect CPC and CPA. A higher-performing creative reduces the cost of each click and improves post-click conversion likelihood when messaging is consistent.
Establish a structured creative testing cadence. Test variations of hooks, visuals, and formats. Identify top performers and rotate out fatigued creatives before CPA degrades. The teams that consistently beat their CPA targets are the ones running creative that refreshes every two to three weeks.
Retargeting campaigns typically produce significantly lower CPA than cold audience campaigns because they reach users who have already demonstrated interest. Segment your retargeting audiences by behavior: cart abandoners, product page viewers, and blog readers should all receive different messaging with different urgency levels.
Retargeting audience size is limited by traffic volume, so it cannot replace cold acquisition campaigns. But it should be a consistent component of every acquisition strategy.
Reallocating budget toward campaigns, ad sets, and keywords with the lowest CPA, and reducing spend on high-CPA segments, is one of the fastest ways to improve blended CPA across a program.
Automated bid strategies (such as Target CPA in Google Ads) can improve efficiency at scale, but they require sufficient conversion data to function accurately. Google typically recommends a minimum of 30 to 50 conversions per month per campaign for Target CPA bidding to work reliably.
In paid search, irrelevant search queries drive clicks that rarely convert, inflating CPA. Regular negative keywords audits prevent spend from being wasted on low-intent traffic. The same principle applies to placement exclusions in display and video campaigns: excluding low-performing placements that reduces wasted impressions and improves CPA.
CPA does not exist in isolation. It is most useful when connected to downstream metrics like LTV, ROAS, and revenue forecasting. This is where CPA moves from a tactical metric to a strategic planning tool.
A known CPA, combined with a target customer acquisition volume, allows marketers to project required budget and expected revenue. This is the foundation of performance-based budget planning.
Example: If the target is 500 new customers and CPA is $40, the required acquisition budget is $20,000. If average TV is $150, projected revenue from that cohort is $75,000 and the LTV:CPA ratio is 3.75:1, which signals healthy acquisition economics.
This kind of math is what separates performance marketers from media buyers. When you can project revenue from spend with reasonable accuracy, you earn a seat at the strategy table.
CPA does not capture customer quality. Two campaigns with identical CPAs may acquire customers with very different LTV profiles, making CPA alone an incomplete basis for optimization decisions. A retargeting campaign and a cold prospecting campaign might both show a $60 CPA, but the cold prospecting customers might have 40% higher LTV.
CPA is also sensitive to attribution model choice, conversion window settings, and how “acquisition” is defined. Changes to any of these inputs can shift CPA without any actual change in marketing performance. Always report CPA alongside the methodology used to calculate it.
CPA is one of the most important metrics in performance marketing, but only when it is calculated completely, interpreted in context, and connected to business outcomes.
The marketers who get the most value from CPA are the ones who account for all costs (not just ad spend), evaluate CPA against LTV (not against industry averages alone), understand how their attribution model shapes the numbers, and use CPA as one input in a broader decision-making framework that includes ROAS, ROI, and customer quality.
If your CPA reporting feels disconnected from actual business results, the issue is almost always one of three things: incomplete cost accounting, misattributed conversions, or missing LTV context. Fix those, and CPA becomes the strategic lever it is supposed to be.
Triple Whale brings all of your acquisition data into a single source of truth, giving you complete visibility into true CPA across every channel, so you can make faster, more profitable growth decisions.
Cost per acquisition (CPA) is the total cost to acquire one customer or conversion through a specific marketing campaign or channel. It is calculated by dividing total campaign costs by the number of conversions. CPA is also sometimes referred to as a cost per action in certain CPA digital marketing contexts, though the terms are used interchangeably.
CPA is a campaign-level metric that measures the cost of a single conversion from a specific channel or campaign. CAC (customer acquisition cost) is a business-wide metric that includes all sales and marketing costs divided by total new customers. CPA is tactical and CAC is strategic. In simple models they can be similar, but in multi-channel businesses they often diverge significantly.
Neither is better, as they measure different things. CPC measures the cost of generating a click (traffic), while CPA measures the cost of generating a conversion (a customer). CPC is a media buying metric, where CPA is a business performance metric. A low CPC is only valuable if those clicks convert at a reasonable rate. Use both together: CPC to manage traffic costs, and CPA to evaluate acquisition efficiency.
A complete CPA calculation should include ad spend, creative production costs, agency or freelancer fees, marketing software subscriptions, attribution tooling costs, and any other expenses directly tied to the campaign. Only counting ad spend produces an artificially low CPA that overstates profitability.
Not necessarily. If reducing CPA also reduces customer quality, average order value, or lifetime value, you could be optimizing toward a less profitable business. A $30 CPA that brings in customers with $80 LTV is worse than a $60 CPA that brings in customers with $300 LTV. Always evaluate CPA in the context of the LTV:CPA ratio and customer quality.
Every marketer tracks (and should track) CPA. It shows up in dashboards, anchors campaign reviews, and drives budget conversations with leadership. But, here’s the thing: most teams are calculating it wrong.
Teams might divide ad spend by conversions and call it a day, only left to wonder why their profitable-looking campaigns somehow aren’t moving the bottom line. The disconnect usually comes down to incomplete cost accounting, mismatched attribution, or treating CPA like it’s a standalone metric instead of connecting it to what a customer is actually worth over time.
This guide breaks down what cost per acquisition actually is, how to calculate it completely, how it compares to related metrics like CAC and CPL, and how to use it as a strategic tool for profitable growth.
Whether you’re running paid social for a DTC brand or managing multi-channel programs for a SaaS company, this is the CPA resource you’ll keep coming back to.
Key takeaways
Cost per acquisition (CPA) is a marketing metric that measures the total cost of acquiring a single customer or conversion through a specific campaign or channel.
The formula is simple: divide the total campaign costs by the number of conversions. But the most important word in that definition is total. CPA should reflect every dollar that contributed to generating that conversion, not just the ad spend.
What counts as an “acquisition” depends on your business model. For ecommerce, it typically means a completed purchase. For SaaS, it could be a trial signup or a paid subscription. For a lead-gen business, it might be a qualified lead or a closed deal. Getting this definition right before you calculate anything is crucial, because a vague conversion event produces a meaningless CPA.
CPA functions as an efficiency ratio. It tells you how much revenue-generating activity each marketing dollar is producing. That is why it matters beyond basic cost tracking. When CPA is accurate and consistently measured, it becomes the common language between marketing, finance, and leadership for evaluating campaign performance.
CPA gives you a single, comparable number to evaluate campaign efficiency across channels, audiences, and time periods. Without it, you’re stuck comparing apples to oranges: clicks in one report, impressions in another, and no clear way to tell which campaign is actually driving profitable growth.
CPA also directly supports budget justification. When you can tell leadership that a campaign produced 200 customers at a CPA of $45 against a customer lifetime value (LTV) of $180, you are speaking in terms that resonate with finance teams. Return on investment and profitable economics will help get those budgets approved.
That said, CPA is most useful when evaluated relative to profit margins on customer lifetime value. A $50 CPA is excellent for a brand with $200 average order values and 60% margins. It is terrible for a brand with $70 AOVs and 30% margins. This detail will be investigated further in the LTV:CPA section to come.
CPA is used across paid search, paid social, affiliate marketing, email, and content marketing, but the way it is calculated and interpreted differs by channel. In paid search, CPA is typically straightforward because conversion tracking ties directly to ad clicks. In content marketing, CPA requires a longer measurement window because the investment in content production is spread across many conversions over time.
One important distinction: in Google Ads, “target CPA” refers to an automated bid strategy that uses machine learning to optimize bids toward a specified cost per conversion. That is a related but distinct use of the term from the analytical metrics covered in this article. When someone references CPA in a strategic planning context, they are talking about the measured cost of acquiring a customer, not a bid setting.
The standard formula is:
An alternative version uses cost per click and conversion rate: CPA = CPC Conversion Rate. This is useful when you know your media buying costs and landing page conversion rate but do not have a campaign-level cost total readily available.
This is where most CPA calculations fall apart. Too many teams only count ad spend, which produces an artificially low CPA that overstates campaign profitability. A true CPA calculation should include every cost that contributed to generating those conversions:
Underreporting costs by only counting ad spend is the most common mistake in CPA calculation. It makes campaigns look more profitable than they are, which leads to poor budget allocation decisions downstream. Audit your cost inputs before you trust your CPA number.
Here’s a realistic ecommerce CPA calculation:
Scenario: A DTC skincare brand runs a Q1 acquisition campaign across Meta and Google.
If this brand had only counted the $20,000 spent on ads, the CPA would appear to be $50, understating the true cost by 29%. That gap matters when you are making decisions about whether to scale the campaign.
Marketers frequently conflate CPA with CAC, CPL, and CPC. Using the wrong metric for the wrong decision leads to misaligned optimization efforts. Here is a clear disambiguation:
CAC is a broader business metric. It typically includes all sales and marketing costs across a time period, including salaries, software, overhead, and every channel, divided by the total number of new customers acquired. CPA, by contrast, is campaign-specific and tied to a defined conversion event.
CPA and CAC can be equal in simple business models where a single campaign drives all acquisition. But they diverge significantly in businesses with long sales cycles, multiple touchpoints, or blended channel spend.
CPL measures the cost to generate a lead, which is a top-of-funnel action. CPA measures the cost to complete an acquisition, a downstream conversion event. For lead-gen businesses, both are necessary: CPL tracks pipeline efficiency, while CPA tracks revenue efficiency. A brand with a $10 CPL and a 10% lead-to-customer conversion rate has a $100 CPA from that channel.
CPC is a media buying metric that measures the cost of driving traffic, not conversions. It sits earlier in the funnel than CPA and does not account for what happens after the click. A low CPC does not guarantee a low CPA. If your landing page conversion rate is poor, high click volume can produce a very high CPA despite efficient media buying. The relationship is direct: CPA = CPC Conversion Rate.
ROAS (return on ad spend) measures revenue generated per dollar of ad spend, while CPA measures the cost to generate a single conversion. They answer different questions and should be used together, not interchangeably. A campaign with a $40 CPA and a $200 average order value produces a 5:1 ROAS, which sounds excellent. But if that campaign only counted ad spend and the true all-in CPA is $80, the picture changes.
ROI goes further than both CPA and ROAS by incorporating profit margins and total costs, making it the most complete measure of business performance. Smart teams track all three: CPA for campaign-level efficiency, ROAS for revenue generation, and ROI for profitability.
There is no universal “good” CPA. The right number depends on your profit margins, average order value, and customer lifetime value. A $100 CPA is fantastic for a brand selling $500 products with 70% margins. That same CPA is a death sentence for a brand selling $80 products with 25% margins.
The LTV:CPA ratio is the most practical tool for evaluating whether a CPA is acceptable. The widely used benchmark is 3:1: if customer lifetime value is three times the cost per acquisition, the acquisition is generally profitable after accounting for cost of goods sold (COGS), fulfillment, customer service, and overhead.
The logic behind 3:1 is straightforward. If your LTV is $150 and your CPA is $50, you have $100 of remaining revenue to cover product costs, operations, and profit. At a 3:1 ratio, most business models can sustain healthy margins. Below that, things get tight.
How profit margins and AOV affect your target CPA
Two businesses with the same CPA can have very different profitability outcomes depending on their unit economics.
Example: Both Brand A and Brand B have a $50 CPA:
Brand A is highly profitable at a $50 CPA. Brand B is losing money on every acquisition. The takeaway: target CPA should always be calculated backward from margin and LTV, not benchmarked against competitors or industry averages in isolation.
The following benchmarks are based on aggregated Triple Whale data from over 40,000 ecommerce ad accounts and $21 billion in ad spend over the trailing 12 months. These are median CPA figures. Industries with fewer than 100 ad accounts or under $1 million in total ad spend have been excluded.
Median CPAs across ecommerce industries range from roughly $26 to $50. The two largest categories by spend — Apparel & Accessories and Health & Beauty — both land right around $31, which makes that figure a reasonable baseline for DTC brands evaluating their own performance. Higher ticket verticals like Home & Garden, Electronics, and Travel Accessories & Luggage naturally sit higher in the $40-$43 range, while lower-AOV categories like Books, Baby, and Food & Beverage tend to cluster under $30.
CPA is not a single number across a marketing program. It varies significantly by channel because each channel reaches different audiences at different stages of the funnel with different intent levels. Cross-channel CPA comparison requires consistent conversion tracking and a shared attribution framework.
Paid search typically produces lower CPA for high-intent queries because users are actively searching for a solution. But competitive keywords drive up cost per click (CPC), which can erode CPA efficiency.
Quality Score, negative keywords, and bid strategy are the primary levers for managing CPA in Google Ads. Campaigns targeting branded keywords will almost always have a lower CPA than non-branded campaigns, which is important to separate when evaluating performance.
Paid social reaches users who are not actively searching, so CPA tends to be higher for cold audiences. But it can be reduced significantly through audience segmentation and retargeting. Ad creative quality has an outsized impact on CPA in paid social compared to other channels. A strong creative can reduce CPA by improving both click-through rate (CTR) and post-click conversion rate simultaneously. Creative fatigue is real, here: When a winning ad starts to plateau, CPA creeps up, and Teams need a structured testing cadence to stay ahead.
Affiliate is a performance-based channel where CPA is often fixed by contract: the advertiser pays a set commission per acquisition. This makes CPA predictable, but it requires careful margin management. Affiliate CPA can also appear artificially low if attribution is not properly configured, since affiliates may receive credit for conversions that would have occurred organically.
Content marketing has a delayed and distributed CPA. The upfront investment in content production and optimization is spread across many conversions over time, making CPA calculation require a longer measurement window. The advantage is that SEO CPA tends to decrease over time as content compounds. That is a key structural advantage over paid channels, where CPA is directly tied to ongoing spend.
Email marketing typically produces the lowest CPA of any channel because it targets an existing audience with established brand familiarity. But this efficiency depends on list quality and segmentation. Teams should still account for platform costs, content production, and list management overhead to avoid understating the true cost. Email CPA can also be misleading if it is credited with conversions that were already in progress through other channels.
Attribution is one of the most significant operational challenges in CPA measurement. When a customer interacts with multiple touchpoints before converting, assigning the full acquisition cost to a single channel produces a distorted CPA.
Last-click attribution, which many platforms default to, gives all conversion credit to the final touchpoint. This overvalues bottom-of-funnel channels (branded search, retargeting) and undervalues the awareness and consideration channels (paid social, content) that initiated the customer journey. The result: marketers underinvest in top-of-funnel activity because its CPA looks inflated, and overinvest in retargeting because its CPA looks artificially low.
Multi-touch attribution (MTA) models distribute credit across multiple touchpoints, which produces a more accurate CPA per channel. Linear attribution splits credit equally. Time-decay models give more credit to recent touchpoints. Position-based models weight the first and last interactions more heavily. Each approach has tradeoffs, and none is perfectly objective.
The practical reality is that MTA models require robust infrastructure and consistent tracking across channels. They are more accurate than last-click, but they are also more complex to implement and maintain. The key takeaway for CPA measurement: understand which attribution model your CPA numbers are based on, and factor that context into every optimization decision.
Before optimizing CPA, you need to understand which variables are driving it up or down. Some are within your control, and others are not.
Not all CPA optimization tactics are equal. Some are high-impact but resource-intensive. Others are quick wins. The table below ranks the most common optimization levers by estimated impact, time to implement, and resource requirements.
Landing page CRO is typically the highest-leverage CPA reduction tactic because it improves the efficiency of every dollar already being spent. If your conversion rate goes from 3% to 4%, your CPA drops by 25% across the entire campaign without changing a single ad setting.
Start with A/B testing headlines and calls to action. Reduce form friction by removing unnecessary fields. Align landing page messaging with ad copy so visitors get a consistent experience from click to conversion. And do not overlook page load speed, which directly impacts both conversion rate and ad platform quality scores.
Tighter audience segmentation reduces wasted spend on users unlikely to convert. Build lookalike audiences from high-LTV customers, not just any customers. Exclude existing customers from acquisition campaigns to avoid paying to reach people you have already acquired. Use behavioral and intent signals to qualify audiences before they enter your funnel.
One caution: over-narrowing audiences can reduce scale and actually increase CPA by limiting the algorithm’s ability to optimize delivery. There is a targeting precision vs. reach tradeoff to manage.
In paid social especially, creative quality directly affects both CTR and ad relevance scores, which in turn affect CPC and CPA. A higher-performing creative reduces the cost of each click and improves post-click conversion likelihood when messaging is consistent.
Establish a structured creative testing cadence. Test variations of hooks, visuals, and formats. Identify top performers and rotate out fatigued creatives before CPA degrades. The teams that consistently beat their CPA targets are the ones running creative that refreshes every two to three weeks.
Retargeting campaigns typically produce significantly lower CPA than cold audience campaigns because they reach users who have already demonstrated interest. Segment your retargeting audiences by behavior: cart abandoners, product page viewers, and blog readers should all receive different messaging with different urgency levels.
Retargeting audience size is limited by traffic volume, so it cannot replace cold acquisition campaigns. But it should be a consistent component of every acquisition strategy.
Reallocating budget toward campaigns, ad sets, and keywords with the lowest CPA, and reducing spend on high-CPA segments, is one of the fastest ways to improve blended CPA across a program.
Automated bid strategies (such as Target CPA in Google Ads) can improve efficiency at scale, but they require sufficient conversion data to function accurately. Google typically recommends a minimum of 30 to 50 conversions per month per campaign for Target CPA bidding to work reliably.
In paid search, irrelevant search queries drive clicks that rarely convert, inflating CPA. Regular negative keywords audits prevent spend from being wasted on low-intent traffic. The same principle applies to placement exclusions in display and video campaigns: excluding low-performing placements that reduces wasted impressions and improves CPA.
CPA does not exist in isolation. It is most useful when connected to downstream metrics like LTV, ROAS, and revenue forecasting. This is where CPA moves from a tactical metric to a strategic planning tool.
A known CPA, combined with a target customer acquisition volume, allows marketers to project required budget and expected revenue. This is the foundation of performance-based budget planning.
Example: If the target is 500 new customers and CPA is $40, the required acquisition budget is $20,000. If average TV is $150, projected revenue from that cohort is $75,000 and the LTV:CPA ratio is 3.75:1, which signals healthy acquisition economics.
This kind of math is what separates performance marketers from media buyers. When you can project revenue from spend with reasonable accuracy, you earn a seat at the strategy table.
CPA does not capture customer quality. Two campaigns with identical CPAs may acquire customers with very different LTV profiles, making CPA alone an incomplete basis for optimization decisions. A retargeting campaign and a cold prospecting campaign might both show a $60 CPA, but the cold prospecting customers might have 40% higher LTV.
CPA is also sensitive to attribution model choice, conversion window settings, and how “acquisition” is defined. Changes to any of these inputs can shift CPA without any actual change in marketing performance. Always report CPA alongside the methodology used to calculate it.
CPA is one of the most important metrics in performance marketing, but only when it is calculated completely, interpreted in context, and connected to business outcomes.
The marketers who get the most value from CPA are the ones who account for all costs (not just ad spend), evaluate CPA against LTV (not against industry averages alone), understand how their attribution model shapes the numbers, and use CPA as one input in a broader decision-making framework that includes ROAS, ROI, and customer quality.
If your CPA reporting feels disconnected from actual business results, the issue is almost always one of three things: incomplete cost accounting, misattributed conversions, or missing LTV context. Fix those, and CPA becomes the strategic lever it is supposed to be.
Triple Whale brings all of your acquisition data into a single source of truth, giving you complete visibility into true CPA across every channel, so you can make faster, more profitable growth decisions.
Cost per acquisition (CPA) is the total cost to acquire one customer or conversion through a specific marketing campaign or channel. It is calculated by dividing total campaign costs by the number of conversions. CPA is also sometimes referred to as a cost per action in certain CPA digital marketing contexts, though the terms are used interchangeably.
CPA is a campaign-level metric that measures the cost of a single conversion from a specific channel or campaign. CAC (customer acquisition cost) is a business-wide metric that includes all sales and marketing costs divided by total new customers. CPA is tactical and CAC is strategic. In simple models they can be similar, but in multi-channel businesses they often diverge significantly.
Neither is better, as they measure different things. CPC measures the cost of generating a click (traffic), while CPA measures the cost of generating a conversion (a customer). CPC is a media buying metric, where CPA is a business performance metric. A low CPC is only valuable if those clicks convert at a reasonable rate. Use both together: CPC to manage traffic costs, and CPA to evaluate acquisition efficiency.
A complete CPA calculation should include ad spend, creative production costs, agency or freelancer fees, marketing software subscriptions, attribution tooling costs, and any other expenses directly tied to the campaign. Only counting ad spend produces an artificially low CPA that overstates profitability.
Not necessarily. If reducing CPA also reduces customer quality, average order value, or lifetime value, you could be optimizing toward a less profitable business. A $30 CPA that brings in customers with $80 LTV is worse than a $60 CPA that brings in customers with $300 LTV. Always evaluate CPA in the context of the LTV:CPA ratio and customer quality.

CPA measures more than ad spend. Learn how to calculate true cost per acquisition, compare it to CAC and CPL, and set profitable LTV-based targets.
Body Copy: The following benchmarks compare advertising metrics from April 1-17 to the previous period. Considering President Trump first unveiled his tariffs on April 2, the timing corresponds with potential changes in advertising behavior among ecommerce brands (though it isn’t necessarily correlated).


.webp)

.webp)


.png)


.png)
.png)
.png)