


The ecommerce community has been on a bit of a rollercoaster over the past few years, with plenty of highs and lows. From the pandemic driving a record-breaking surge in online shopping to a breakdown in supply chains to inflation, rising costs, and shifts in consumer behavior – brand owners have needed to stay agile and adaptable to be successful.
Global ecommerce sales continue to grow, with total retail ecommerce sales expected to surpass $8 trillion by 2027.
As the revenue climbs for ecommerce, so does the funds devoted to ad spend. 2024 had a surge in digital advertising spend and surpassed $1 trillion globally for the first time, representing a 9.5% increase compared to 2023.
In this article, we’ll break down some ad performance metrics for Triple Whale brands in 2024, including average order value, spend by ad channel, CPA by industry, and overall ad performance metrics by channel. For industry metrics, we have also included some sub-categories in this report to give you the full picture. With this information, brands can better prepare for how to allocate their ad spend in 2025.
The industry with the highest AOV was Computers, which likely represents the high-priced items purchased in this category. Similarly, Home & Garden ($145.86) had high average order values most likely linked to higher-priced items in this category.
Health & Beauty ($164.22) and Office Products ($144.49) had high average order values, likely due to bulk purchases, premium pricing, or recurring needs (especially for beauty products).
In the middle range for AOV are industries like Fashion Accessories ($88.23) and Pet Supplies ($73.05), which may benefit from upselling and cross-selling to increase the average order value.
Industries with the lowest AOV were Digital Products ($51.42) and Books ($58.98). These industries should focus on ways to increase average order values by pushing loyalty programs and bundling to obtain more revenue per purchase.

Facebook Ads (including Instagram) dominated ad spend, with over $7 billion spent on ads on the platform. This indicates that brands prefer spending on social media for awareness campaigns, and that Facebook remains the most effective and scalable ad platform for ecommerce brands.
In a not-so-close second place was Google Ads with $2.82 billion, with far less ad spend devoted to search-based intent marketing. However, if most brands are focused on social media to drive awareness, less money would need to be spent on Google Ads if customers use Google to find a product they were already aware of.
Amazon Ads ($421 million) and TikTok ($393 million) represent the up-and-coming ad platforms that ecommerce brands are focused on optimizing. Amazon is important for direct product purchases (and a place consumers will often search first for a product). TikTok is well-suited to discovery-driven commerce.
The remaining platforms represent niche and emerging markets that have moderate spend, comparatively. Brands in niche markets may be well-positioned to utilize these platforms to drive their business.

A massive amount of ad spend was devoted to Facebook Ads in the Clothing industry, with $1.23 billion representing the very large majority of ad spend. This suggests that social media (and especially visual-based platforms like Facebook and Instagram) are ideal platforms for selling clothing.
Clothing brands spent $451 million on Google Ads, less than half the amount spent on Facebook Ads. While search ads work great for customers with high purchase intent, the massive differential between Facebook Ads and Google Ads suggests that discovery-based shopping (while scrolling on social media) is more effective than search-based shopping for clothing.
TikTok emerged as a key player for Clothing ads, with $74 million spent on the platform in 2024. Even though the platform’s ad spend is far lower than Facebook and Google, TikTok has an influence on fashion trends and viral content. It’s clear that brands are increasingly testing and scaling their budgets on TikTok.
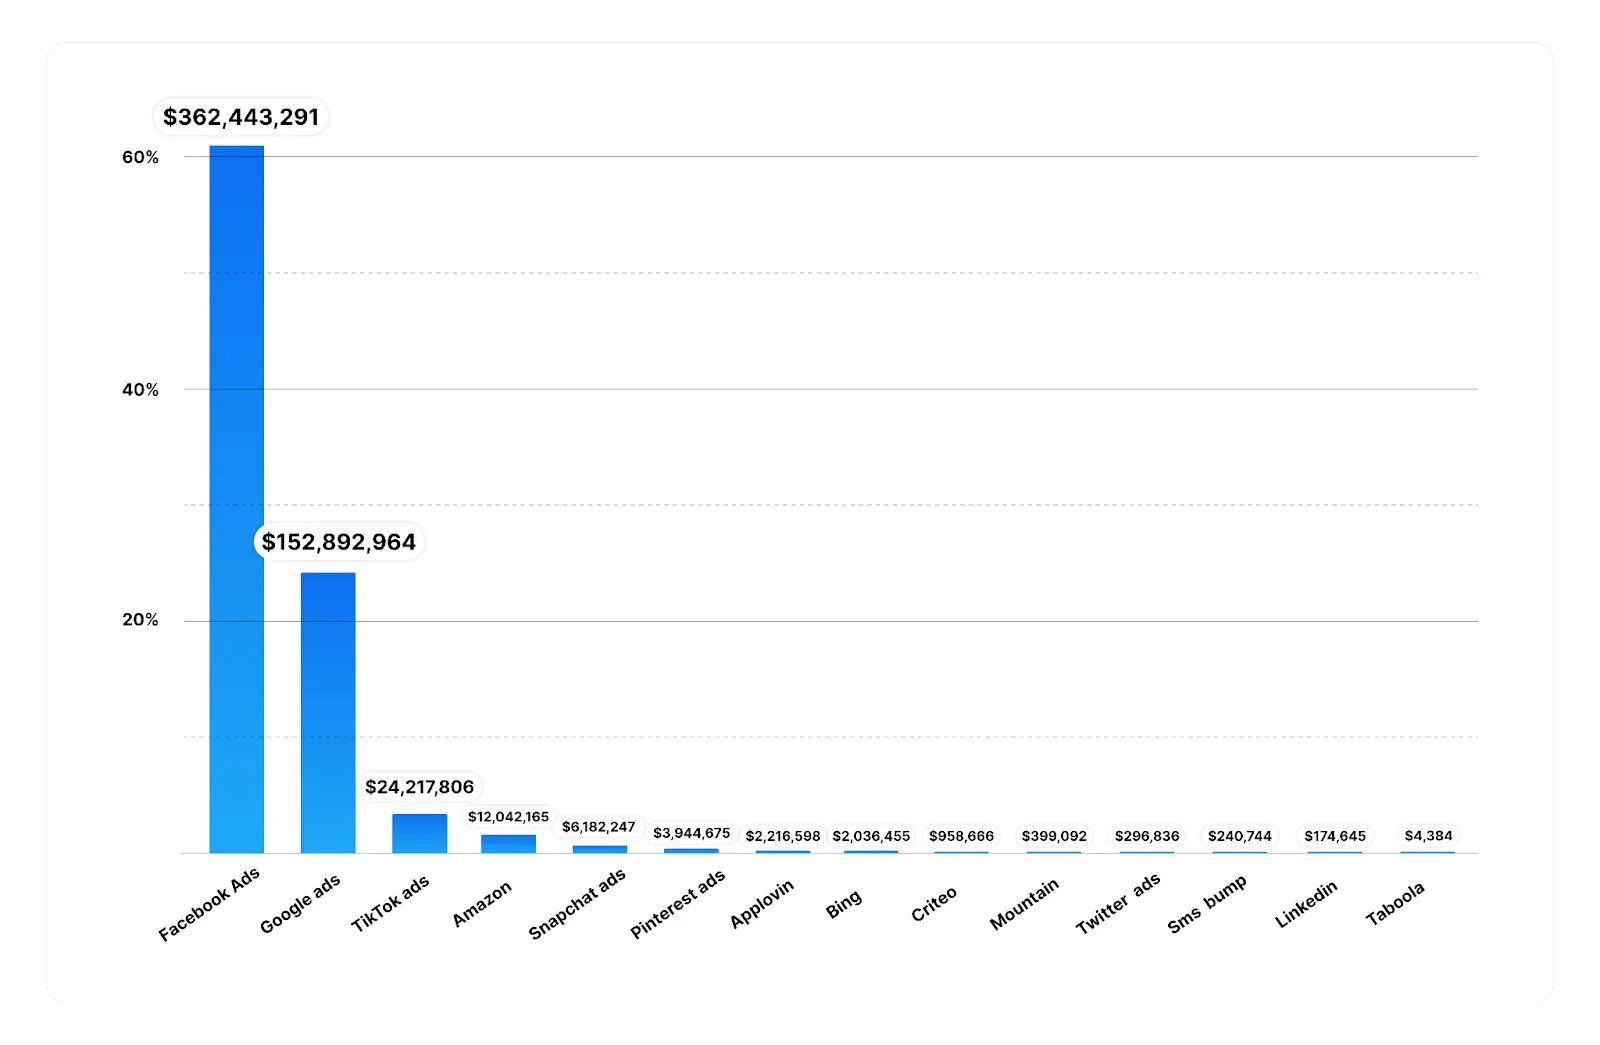
Similar to Clothing, the highest spend by ad platform belonged to Facebook Ads ($362.4 million), followed by Google Ads ($152.8 million). Since fashion accessories tend to be highly visual products, it is not surprising that Facebook and Instagram are some of the best platforms for discovery and conversion.
TikTok ads are gaining ground for Fashion Accessories, with $24.2 million spent on the platform. TikTok’s ability to drive viral trends and impulse shopping – effective for lower-cost items like fashion accessories – impacts ad spend for this platform.

Health + Beauty spent the most on Facebook Ads at $1.68 billion dollars. In second place was Google Ads, with $554 million spent on the platform. In a switch from the above two industries, however, Amazon ($142 million) overtook TikTok ($138 million) as the third place platform. Amazon’s success indicates that Health + Beauty brands succeed with marketplace-driven sales, and discovery on Amazon’s platform. TikTok is still contributing with trend-driven, influencer-led marketing campaigns for Health + Beauty brands.
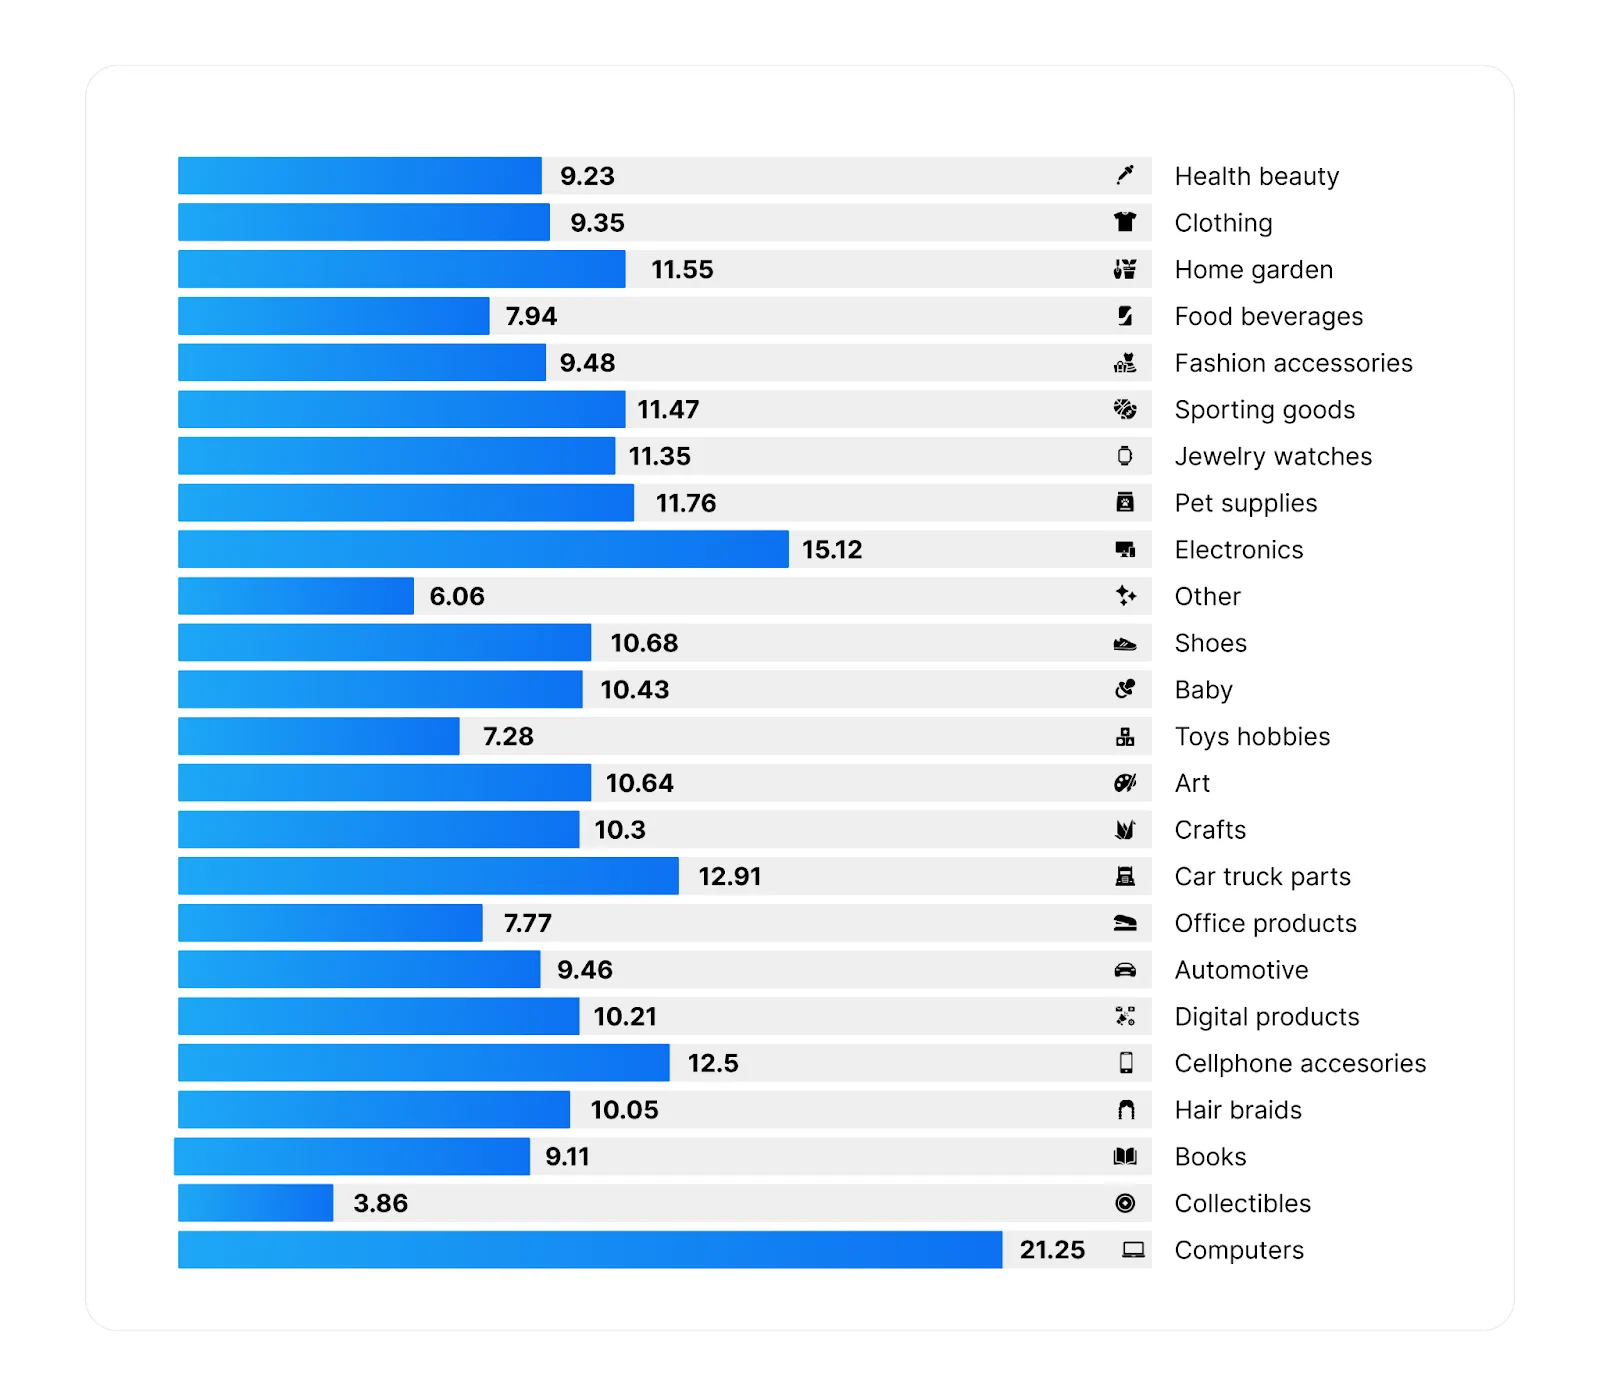
The industry with the highest CPA is Computers ($21.25) followed by Electronics ($15.12), which makes sense as computers and electronics are higher-ticket items, and customers often take longer to make purchasing decisions. Since higher-priced products allow for more expensive customer acquisition costs, a high CPA is justified.
Cellphone Accessories have a relatively high CPA ($12.50) compared to the price point of the product, which suggests high competition and that brands need to work hard to stand out in the crowded market.
Books have the lowest CPA ($3.86) which indicates that consumers are more likely to buy a book without much hesitation since it’s a lower-cost item. There may also be less competition amongst advertising brands.

In 2024, both Amazon and Google Ads were the most efficient ad platforms. They had the highest ROAS, strong conversion rates, and high AOV, which made them both a great platform for revenue-driven strategies.
Facebook and TikTok had high click-through rates (CTR), but were less efficient at driving sales. This suggests these platforms are better for brand awareness or selling lower-ticket items.
Bing and Taboola had cost-effective acquisition, but had poor ROAS, which suggests they might be better ad platforms for top-of-funnel awareness strategies.
In 2025, it’s likely that brands will shift more of their budget towards Amazon and Google Ads for conversions, while using platforms like Facebook and TikTok for awareness.
As 2024 demonstrated, ecommerce brands continue to navigate an ever-changing landscape, balancing shifts in consumer behavior, rising costs, and the evolving ad platform ecosystem. With global ecommerce sales and digital ad spend both reaching new record highs, the data reveals key insights into how brands can optimize their strategies moving forward.
High-performing industries leveraged platforms like Facebook and Google effectively, while emerging channels like TikTok and Amazon showed strong potential for discovery and conversion. As we head into 2025, brands that strategically allocate their ad spend—focusing on high-ROAS platforms for conversions and social media for brand awareness—will be best positioned to thrive in a competitive market.
The ecommerce community has been on a bit of a rollercoaster over the past few years, with plenty of highs and lows. From the pandemic driving a record-breaking surge in online shopping to a breakdown in supply chains to inflation, rising costs, and shifts in consumer behavior – brand owners have needed to stay agile and adaptable to be successful.
Global ecommerce sales continue to grow, with total retail ecommerce sales expected to surpass $8 trillion by 2027.
As the revenue climbs for ecommerce, so does the funds devoted to ad spend. 2024 had a surge in digital advertising spend and surpassed $1 trillion globally for the first time, representing a 9.5% increase compared to 2023.
In this article, we’ll break down some ad performance metrics for Triple Whale brands in 2024, including average order value, spend by ad channel, CPA by industry, and overall ad performance metrics by channel. For industry metrics, we have also included some sub-categories in this report to give you the full picture. With this information, brands can better prepare for how to allocate their ad spend in 2025.
The industry with the highest AOV was Computers, which likely represents the high-priced items purchased in this category. Similarly, Home & Garden ($145.86) had high average order values most likely linked to higher-priced items in this category.
Health & Beauty ($164.22) and Office Products ($144.49) had high average order values, likely due to bulk purchases, premium pricing, or recurring needs (especially for beauty products).
In the middle range for AOV are industries like Fashion Accessories ($88.23) and Pet Supplies ($73.05), which may benefit from upselling and cross-selling to increase the average order value.
Industries with the lowest AOV were Digital Products ($51.42) and Books ($58.98). These industries should focus on ways to increase average order values by pushing loyalty programs and bundling to obtain more revenue per purchase.
Facebook Ads (including Instagram) dominated ad spend, with over $7 billion spent on ads on the platform. This indicates that brands prefer spending on social media for awareness campaigns, and that Facebook remains the most effective and scalable ad platform for ecommerce brands.
In a not-so-close second place was Google Ads with $2.82 billion, with far less ad spend devoted to search-based intent marketing. However, if most brands are focused on social media to drive awareness, less money would need to be spent on Google Ads if customers use Google to find a product they were already aware of.
Amazon Ads ($421 million) and TikTok ($393 million) represent the up-and-coming ad platforms that ecommerce brands are focused on optimizing. Amazon is important for direct product purchases (and a place consumers will often search first for a product). TikTok is well-suited to discovery-driven commerce.
The remaining platforms represent niche and emerging markets that have moderate spend, comparatively. Brands in niche markets may be well-positioned to utilize these platforms to drive their business.
A massive amount of ad spend was devoted to Facebook Ads in the Clothing industry, with $1.23 billion representing the very large majority of ad spend. This suggests that social media (and especially visual-based platforms like Facebook and Instagram) are ideal platforms for selling clothing.
Clothing brands spent $451 million on Google Ads, less than half the amount spent on Facebook Ads. While search ads work great for customers with high purchase intent, the massive differential between Facebook Ads and Google Ads suggests that discovery-based shopping (while scrolling on social media) is more effective than search-based shopping for clothing.
TikTok emerged as a key player for Clothing ads, with $74 million spent on the platform in 2024. Even though the platform’s ad spend is far lower than Facebook and Google, TikTok has an influence on fashion trends and viral content. It’s clear that brands are increasingly testing and scaling their budgets on TikTok.
Similar to Clothing, the highest spend by ad platform belonged to Facebook Ads ($362.4 million), followed by Google Ads ($152.8 million). Since fashion accessories tend to be highly visual products, it is not surprising that Facebook and Instagram are some of the best platforms for discovery and conversion.
TikTok ads are gaining ground for Fashion Accessories, with $24.2 million spent on the platform. TikTok’s ability to drive viral trends and impulse shopping – effective for lower-cost items like fashion accessories – impacts ad spend for this platform.
Health + Beauty spent the most on Facebook Ads at $1.68 billion dollars. In second place was Google Ads, with $554 million spent on the platform. In a switch from the above two industries, however, Amazon ($142 million) overtook TikTok ($138 million) as the third place platform. Amazon’s success indicates that Health + Beauty brands succeed with marketplace-driven sales, and discovery on Amazon’s platform. TikTok is still contributing with trend-driven, influencer-led marketing campaigns for Health + Beauty brands.
The industry with the highest CPA is Computers ($21.25) followed by Electronics ($15.12), which makes sense as computers and electronics are higher-ticket items, and customers often take longer to make purchasing decisions. Since higher-priced products allow for more expensive customer acquisition costs, a high CPA is justified.
Cellphone Accessories have a relatively high CPA ($12.50) compared to the price point of the product, which suggests high competition and that brands need to work hard to stand out in the crowded market.
Books have the lowest CPA ($3.86) which indicates that consumers are more likely to buy a book without much hesitation since it’s a lower-cost item. There may also be less competition amongst advertising brands.
In 2024, both Amazon and Google Ads were the most efficient ad platforms. They had the highest ROAS, strong conversion rates, and high AOV, which made them both a great platform for revenue-driven strategies.
Facebook and TikTok had high click-through rates (CTR), but were less efficient at driving sales. This suggests these platforms are better for brand awareness or selling lower-ticket items.
Bing and Taboola had cost-effective acquisition, but had poor ROAS, which suggests they might be better ad platforms for top-of-funnel awareness strategies.
In 2025, it’s likely that brands will shift more of their budget towards Amazon and Google Ads for conversions, while using platforms like Facebook and TikTok for awareness.
As 2024 demonstrated, ecommerce brands continue to navigate an ever-changing landscape, balancing shifts in consumer behavior, rising costs, and the evolving ad platform ecosystem. With global ecommerce sales and digital ad spend both reaching new record highs, the data reveals key insights into how brands can optimize their strategies moving forward.
High-performing industries leveraged platforms like Facebook and Google effectively, while emerging channels like TikTok and Amazon showed strong potential for discovery and conversion. As we head into 2025, brands that strategically allocate their ad spend—focusing on high-ROAS platforms for conversions and social media for brand awareness—will be best positioned to thrive in a competitive market.


Body Copy: The following benchmarks compare advertising metrics from April 1-17 to the previous period. Considering President Trump first unveiled his tariffs on April 2, the timing corresponds with potential changes in advertising behavior among ecommerce brands (though it isn’t necessarily correlated).


.webp)

.webp)


.png)


.png)
.png)
.png)