Amazon‘s Prime Big Deal Days (also known as “Fall Prime Day”) hosts thousands of deals ahead of the holidays. This year’s Prime Big Deal Days ran from October 6 to 7, 2026. Prime members get exclusive offers, discounts, and free shipping.
We analyzed Amazon ad performance from roughly 2,000 brands on Triple Whale during the event. See how you stack up.
Highlights
- Average daily Amazon ad spend increased 148.7% as sellers moved budget into the two-day event.
- Platform-reported purchases rose 183.4% per day, outpacing the jump in spend.
- Median AOV across all industries was $37.91, down 5.1% from the week before.
- Sports and outdoors posted the strongest efficiency gains: ROAS rose 27% and CPA fell 23%.
Ad spend: How brands raised budget for Amazon Big Deal Days 2026
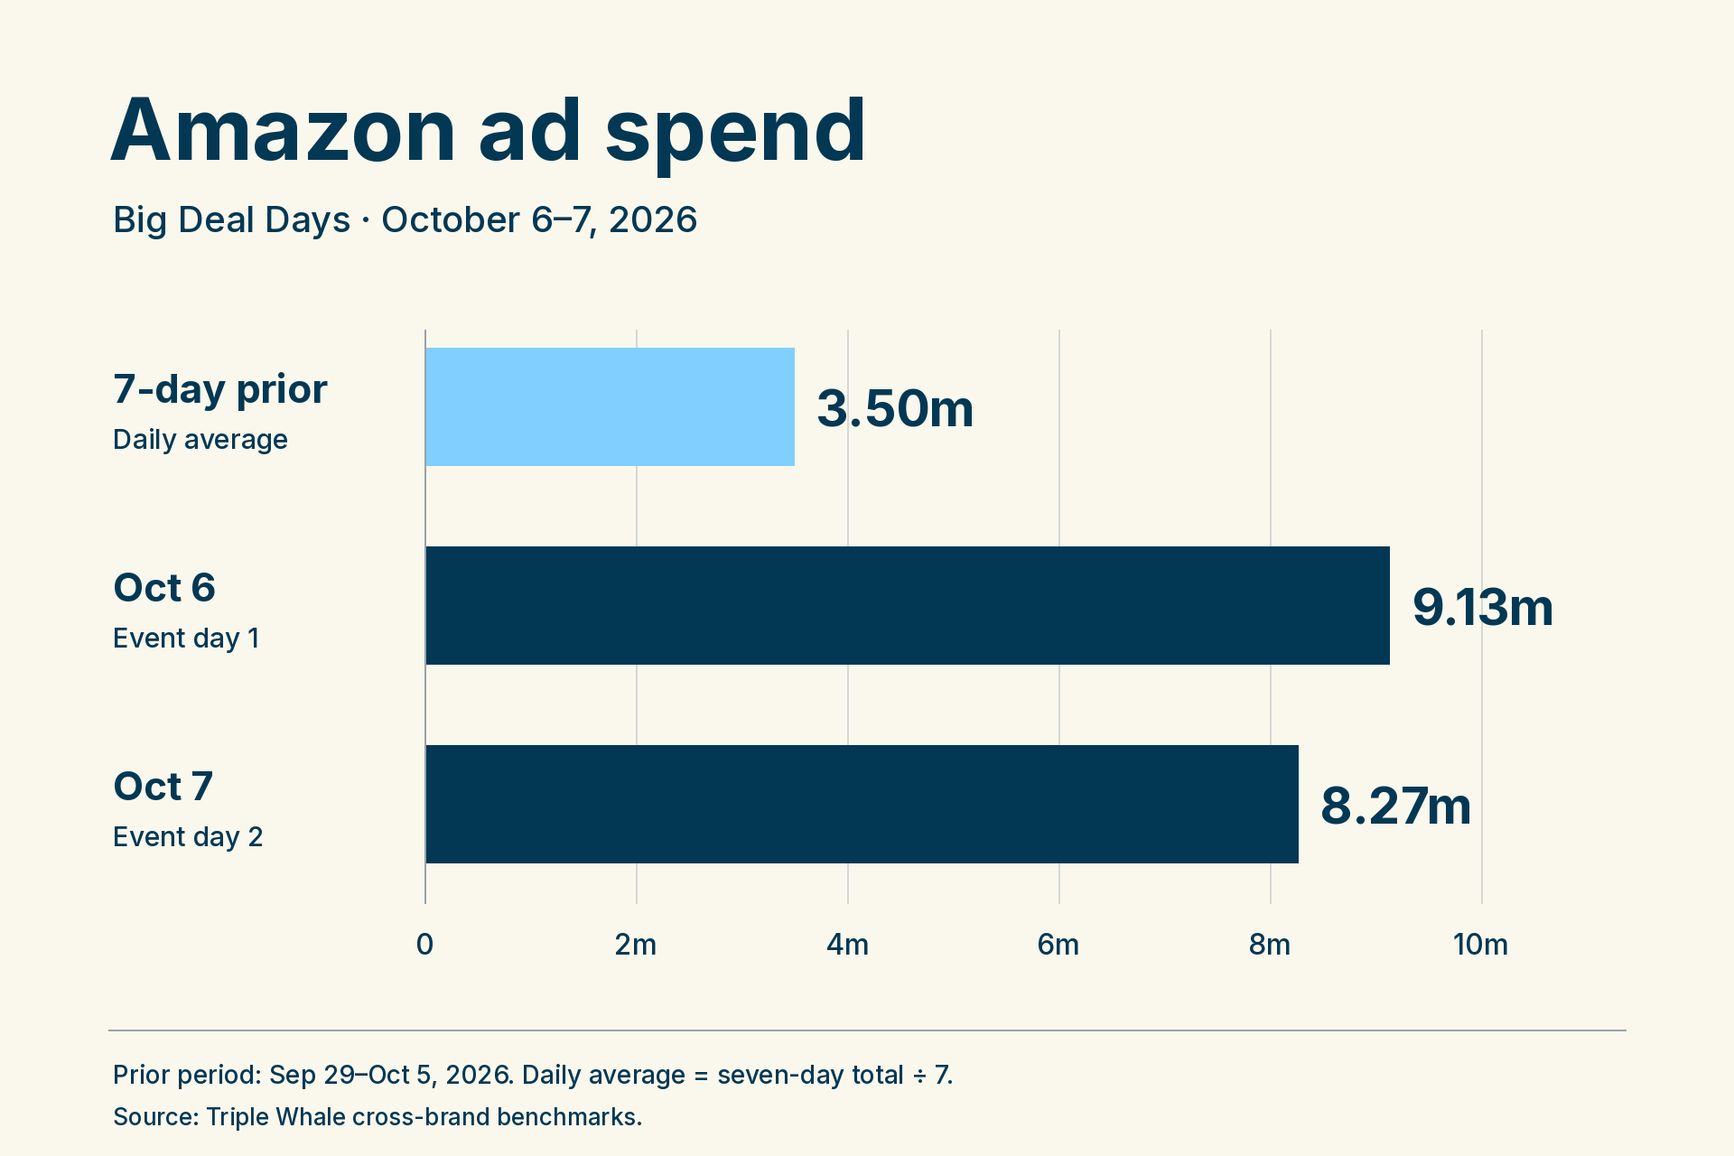
Amazon ad spend more than doubled during the event. Brands in the benchmark spent an average of $8.70 million per day across October 6 and 7, up from $3.50 million per day the week before.
Day one carried the most budget at $9.13 million. Spend pulled back to $8.27 million on day two, still well above the pre-event baseline.
Share of ad spend: Amazon takes a bigger slice of pie
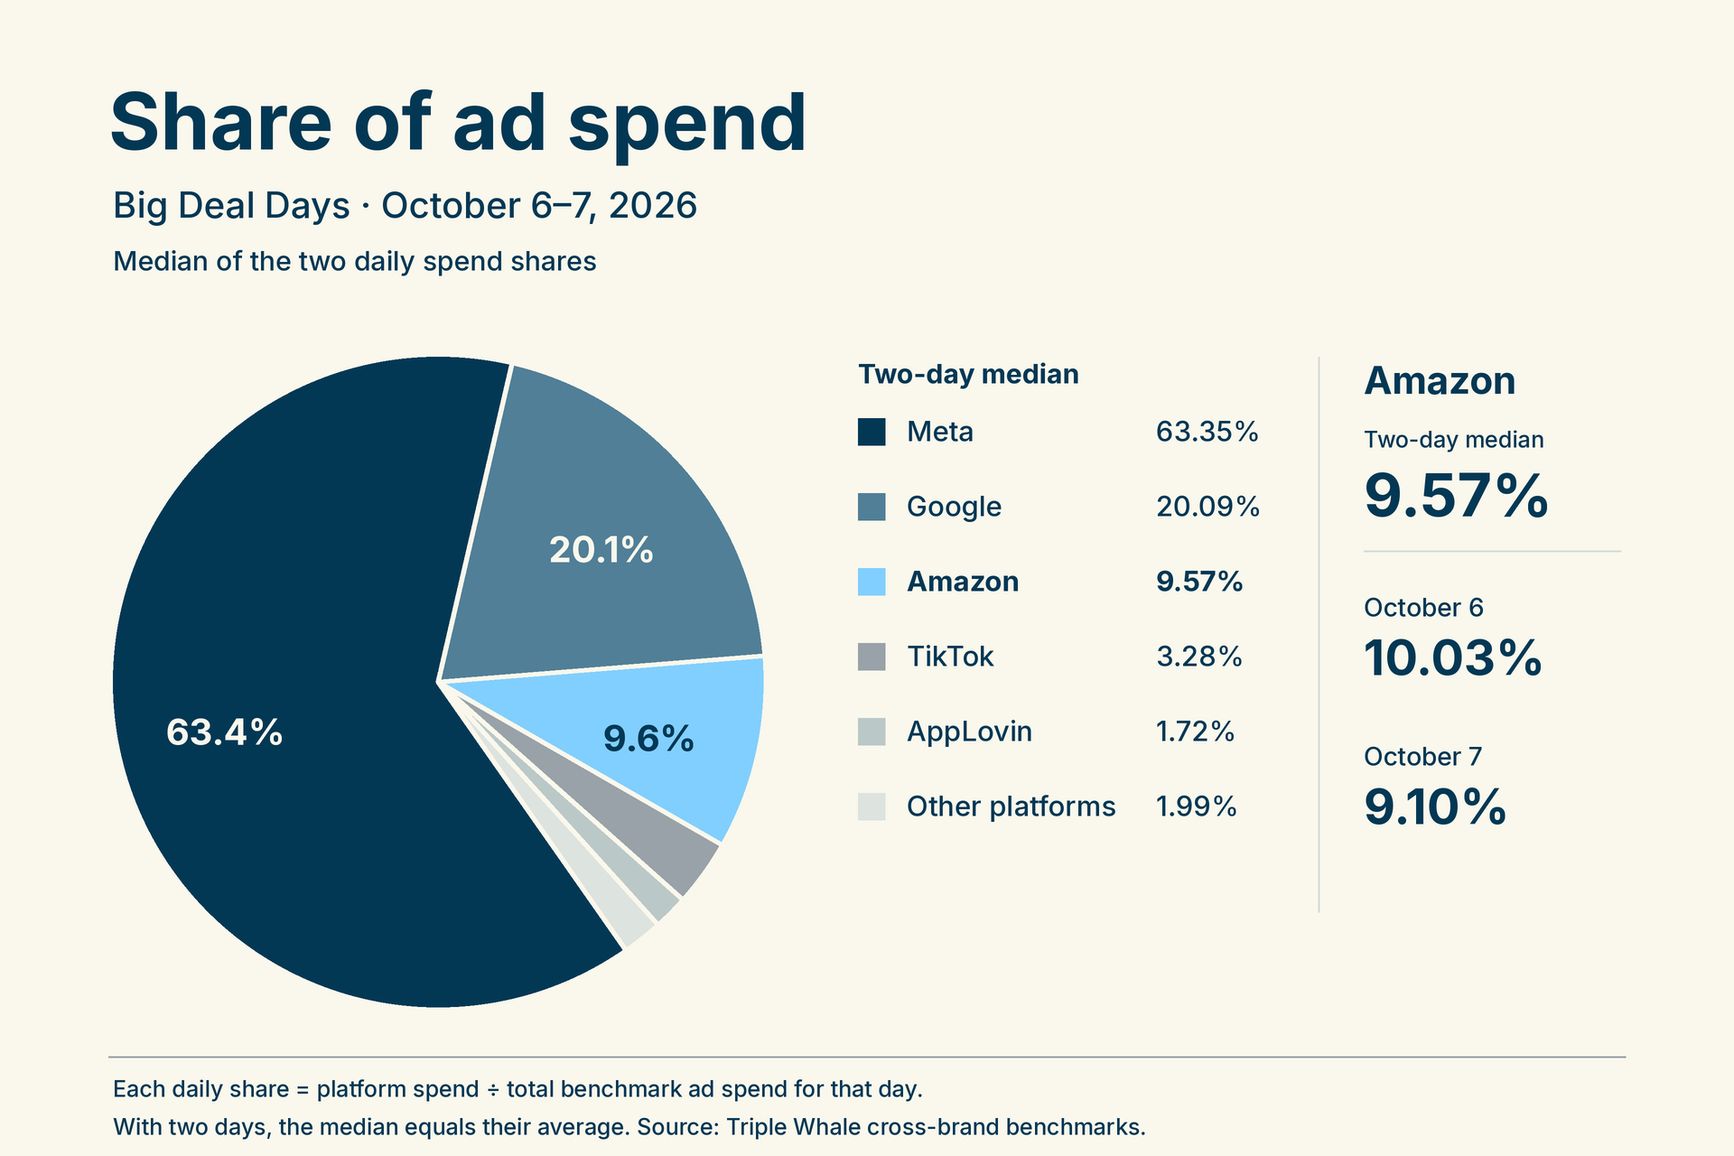
Amazon’s share of spend jumped from 3.95% in the prior period to an average of 9.57% across both event days.
- October 6: 10.03%
- October 7: 9.10%
That’s a 142.1% increase over the seven days leading up to the event.
Meta, Google, Amazon, TikTok, and AppLovin were the top five platforms by reported spend on both days.
Big Deal Days median benchmarks vs. the prior week
Here’s how median Amazon performance during the event compared with the seven days before. CVR was the standout, the only metric to move more than 10%. Lower AOV is worth a margin check if you discounted deeper for the event.
| Median metric | Sept 29 - Oct 5 | Oct 6-7 | Change |
|---|---|---|---|
| ROAS | 2.94x | 3.11x | +5.7% |
| CPA | 14.81 | 13.70 | -7.5% |
| CPC | 1.44 | 1.52 | +5.9% |
| CPM | 7.81 | 7.93 | +1.5% |
| CVR | 9.96% | 11.77% | +18.2% |
| CTR | 0.556% | 0.522% | -6.1% |
| AOV | 39.95 | 37.91 | -5.1% |
Check out the Amazon Big Deal Days: Benchmarks & prompt guide →
Industry benchmarks: how did you perform?
Three categories got the most out of their Amazon ad spend during the event. Sports and outdoors led the group, with ROAS up about 27% and CPA down 23%.
Home and garden improved on both measures, with ROAS up 13% and CPA down 13% even as spending rose. Consumer electronics saw ROAS climb 16% while CPA held steady.
The timing likely explains much of this, as shoppers start buying early holiday gifts and locking in discounts before Black Friday. All three are classic gifting and hosting categories. The Electronics industry in particular tends to reward deal events, since high-ticket items give shoppers more reason to wait for a price drop.
Industry changes vs. the prior week
| Industry | ROAS change | CPA change | Avg. daily spend change |
|---|---|---|---|
| Consumer electronics | +16.3% | -0.3% | +104.3% |
| Apparel and accessories | +2.1% | -10.3% | +132.0% |
| Health and beauty | +3.4% | -8.8% | +179.4% |
| Baby | +5.7% | -1.4% | +240.5% |
| Health and wellness | +5.9% | -5.1% | +64.3% |
| Toys, art, and collectibles | +8.1% | +1.0% | +103.1% |
| Food and beverage | -1.5% | -4.5% | +135.0% |
| Pets and animals | -0.4% | +0.4% | +115.2% |
| Automotive | -9.5% | -0.4% | +65.9% |
A few other results stand out. Health and beauty made up 49.3% of Amazon industry spend, so its moves shape the overall picture. Baby had the largest spend spike, but CPM rose 13.4% and CPA barely moved. Automotive was the only category where ROAS fell meaningfully.
Two-day industry Amazon benchmarks
| Industry | Share of total Amazon ad spend | ROAS | CPA | CPM | CVR | CTR | AOV |
|---|---|---|---|---|---|---|---|
| Health and beauty | 49.30% | 2.70 | 12.59 | 9.33 | 16.22% | 0.48% | 33.01 |
| Home and garden | 12.66% | 4.01 | 16.43 | 6.88 | 7.78%8% | 0.54% | 66.18 |
| Food and beverage | 8.87% | 2.67 | 12.66 | 10.13 | 15.94% | 0.51% | 32.07 |
| Apparel and accessories | 7.37% | 3.47 | 12.69 | 5.41 | 7.83% | 0.55% | 43.97 |
| Pets and animals | 6.25% | 2.46 | 14.55 | 9.11 | 16.52% | 0.42% | 30.99 |
| Sports and outdoors | 2.67% | 4.14 | 13.27 | 6.93 | 7.80% | 0.62% | 62.14 |
| Consumer electronics | 2.60% | 4.43 | 26.89 | 7.42 | 5.53% | 0.49% | 124.98 |
| Baby | 2.21% | 4.10 | 13.59 | 5.91 | 6.98% | 0.55% | 56.50 |
| Health and wellness | 1.74% | 2.71 | 15.69 | 10.94 | 12.63 | 0.54% | 42.15 |
| Automotive | 1.36% | 4.17 | 13.69 | 6.61 | 7.82% | 0.56% | 51.64 |
Now let’s look at the individual days
| Metric | October 6 | October 7 | Day-to-day change |
|---|---|---|---|
| ROAS | 3.34 | 2.90 | -13.2% |
| CPA | 12.81 | 14.68 | +14.6% |
| CPC | 1.48 | 1.57 | +6.2% |
| CPM | 7.54 | 8.29 | +9.9% |
| CVR | 12.13% | 11.30% | -6.9% |
| CTR | 0.52% | 0.53% | +1.9% |
| AOV | 37.99 | 37.83 | -0.4% |
Delivery, reported outcomes, and sample size
| Metric | October 6 | October 7 | Day-to-day change |
|---|---|---|---|
| Ad spend | $9,134,290.34 | $8,267,150.36 | -9.5% |
| Clicks | 5,139,781 | 4,374,740 | -14.9% |
| Impressions | 972,119,495 | 812,235,720 | -16.4% |
| Platforms-related purchases | 984,587 | 744,040 | -24.4% |
| Platform-reported conversion value | 34,746,579.86 | 26,414,978.99 | -24.0% |
| Distinct shops | 1,880 | 1,854 | -1.4% |
| Distinct ad accounts | 2,126 | 2,092 | -1.6% |
Conclusion
Amazon took a bigger slice of ad budgets during Prime Big Deal Days, and efficiency held up as spend scaled. The gains were front-loaded: day one delivered stronger returns than day two on nearly every efficiency metric.
Before you set pacing for Black Friday Cyber Monday, pull your own day-one and day-two numbers and check whether the second day earned its budget. Then measure your event ROAS against your break-even after discounts, Amazon fees, and returns. Median benchmarks show where the market moved. Your margins tell you whether the event paid off.
Data comes from Triple Whale’s Ad Metrics Benchmarks, covering roughly 1,900 brands and 2,100 Amazon ad accounts. We compared October 6–7, 2026, with the prior seven days (September 29–October 5). Metrics are platform-reported medians, and industry tables include only categories with at least 20 shops.