Join us at The Whalies • April 10th
Get Your Ticket
Check our DTC Holiday Gift Guide 🎁
Read Now


As consumer Ecommerce operators, we all have our own unique little niche. In fact, one of my favorite things about the ecosystem is that I meet so many different people selling so many random things. From slime to tattoo lotion, there are a million different 7-9 figure businesses out there that would make you say “wait..what?”
Along with all the unique verticals comes differing trends in demand. Several, if not most of our brands see Q4 as the pinnacle of demand - and realistically, it probably is for most. That said, a lot of industries have a variable demand throughout the year, disregarding the Black Friday/Cyber Monday craze. You may not realize it, but there is a good chance that your ad dollars are better spent in X month vs Y month.
In the early days of Mad Rabbit, we didn’t know about the intense seasonality within the industry, and it cost us a lot. So, in this post, I want to dive into the tools that can help you identify when you might see your highest ROAS (return on ad spend).
Google Trends is, by far, the most useful tool in identifying seasonality. Google trends does not show you a curve of exact volume of searches on Google, but it does show you the relative demand curve throughout the year. Here is a screenshot of the query “tattoo ideas”:

“Tattoo ideas” is a relevant query for Mad Rabbit, as we can assume that most people are looking on the internet for tattoo inspiration shortly before getting inked. This particular keyword peaks in July and bottoms out around December/January. By knowing when this swell is building, we can prepare and deploy ads to the massive summer cohort who need their tattoos to heal well. Multiple other tattoo-related keywords also follow the same demand pattern, so we generally see the most demand for our products and therefore our best ROAS during these months.
My caveat here is that for a lot of brands, keywords related to your vertical will peak in Q4. Use the date filter to hone-in on demand trends during Q1, Q2, and Q3 so that you can see how demand shifts during the course of the year without being influenced by huge spikes in Q4.
Example below for “wallets:”
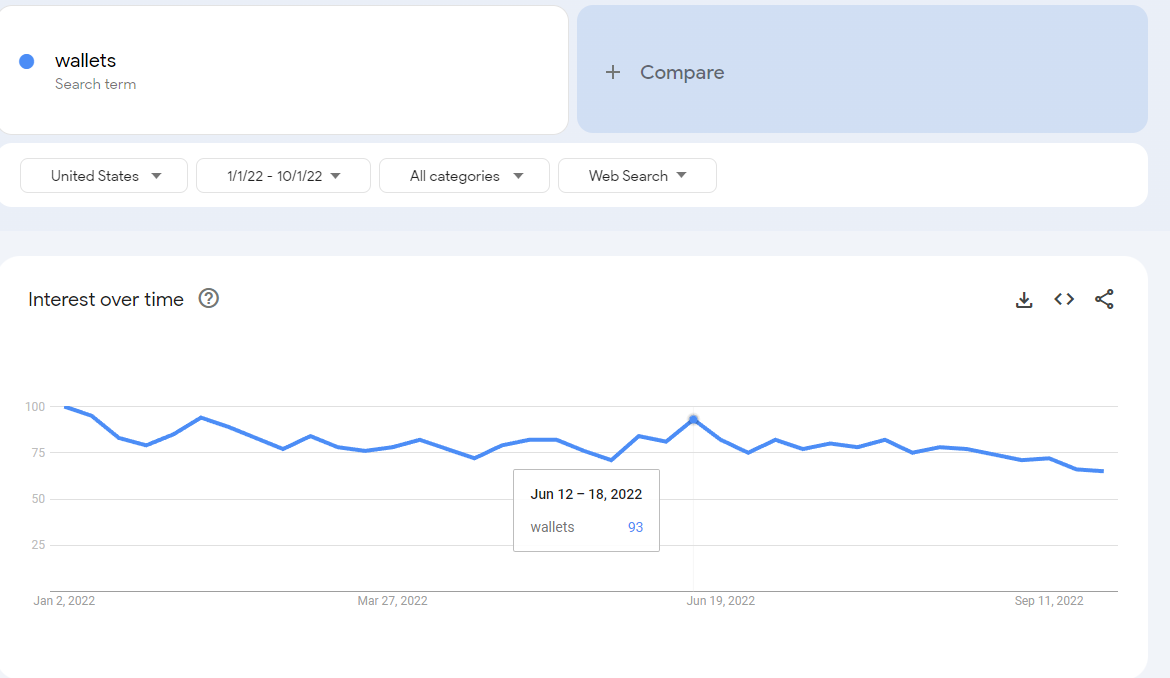
You can see that coming off the peak in January of Q4, there is another peak in June. What happens in June that might cause a spike in wallet sales? Father’s Day. This is obvious to most everyone, but there are many obscure seasonal drivers across industries that might be tougher to uncover.
Another visually-oriented platform that customers may use to seek out inspiration is Pinterest, and the Pinterest Trends tool can show you the search history for various relevant keywords. Additionally, it can display the top search terms across different regions and you can also see what’s trending specifically among your audience.


Understanding what is trending on Pinterest can inform your marketing strategy. For example, if you sell hair care products and see that prom hairstyles are trending, there’s likely a really worthwhile content piece you could run at this time to get a ton of organic views. You could also put out a paid ad campaign that leans into the subject of prom hairstyles to ride the wave.
Pinterest allows you to view yearly, monthly, and weekly changes to trends, and have even added a ‘seasonal trends’ tab in the filters so you can hone-in on seasonal data.

Twitter is an ever-interesting place. By focusing specifically on what is trending in the moment, you can use it to hop on viral moments to get your brand in on the conversation. Tons of brands do this really, really well, by being funny and real as well as relevant. Beyond entertainment and connecting with customers, you can also utilize Twitter to understand seasonal impacts and intra-year trends in two ways: 1) look at what’s trending, and 2) log how many tweets per hour surround a subject.
Twitter has a ‘Trending’ section, so if anything is trending that’s relevant to your sector or industry, you have to quickly get in with a Tweet to leverage this intelligence to get a lot of free clicks or views.

A more nuanced way to use Twitter’s search requires some manual work. Once a week, for a year or two, I would log into Twitter and type ‘tattoos’ in the search bar. A little tag beneath the query shows how many tweet in the last hour have included that word. Understanding how this varies over time can inform just how popular your product is at the moment, and having a little data logged over time can give you a clearer picture.

Amazon Brand Analytics is potentially, in my opinion, the single most powerful data source in Ecommerce. It is little known, however this portal gives you access to copious amounts of data with regards to demand on Amazon, which is giving you copious amounts of data with regards to Ecommerce and consumer goods as a whole.
Amazon recently made huge updates to this dashboard and it displays a ton of useful data. You can see the most popular searches on Amazon, and the most popular products according to any of those searches, for any period of time.

This is just one part of the Amazon Brand Analytics suite, and it definitely can give great insight into seasonality of your product. These queries and data change with the season, and you might find that there’s a better time for you to lean into your Amazon channel for sales.
In summation, every business has some seasonality. It may not be super obvious, but there are days, weeks and months where you should really be leaning in. Conversely, there are times throughout the year where growth should be less of a priority and you should focus on profits and efficiency. Google, Pinterest, Twitter, and Amazon are all home to a lot of this seasonal engagement, and understanding how to leverage these tools and the data they provide can serve as a nice guardrail for how you think about your marketing calendar.

.png)
© Triple Whale Inc.
266 N 5th Street, Columbus OH 43209


