Join us at The Whalies • April 10th
Get Your Ticket
Check our DTC Holiday Gift Guide 🎁
Read Now


Creative is more competitive than ever. Thousands of creators and hundreds of creative agencies produce content that competes with yours.
Advertising platforms and their targeting have become weaker after iOS 14, which moved the spotlight on the creative.
This shift in the advertising industry has raised important questions:
Before we dive deep, let me state that no single method works for everyone. Every business is different and requires a unique approach.
We’ve tried and tweaked many different methods to achieve the best results for our clients. Now, I want to share them with you.
Everyone looks at ROAS. I understand that we want to make money and profit. That’s why we invest in paid advertising in the first place. However, with your eyes stuck on ROAS, you will never understand why some creatives perform better than others and thus won’t know how to improve them.
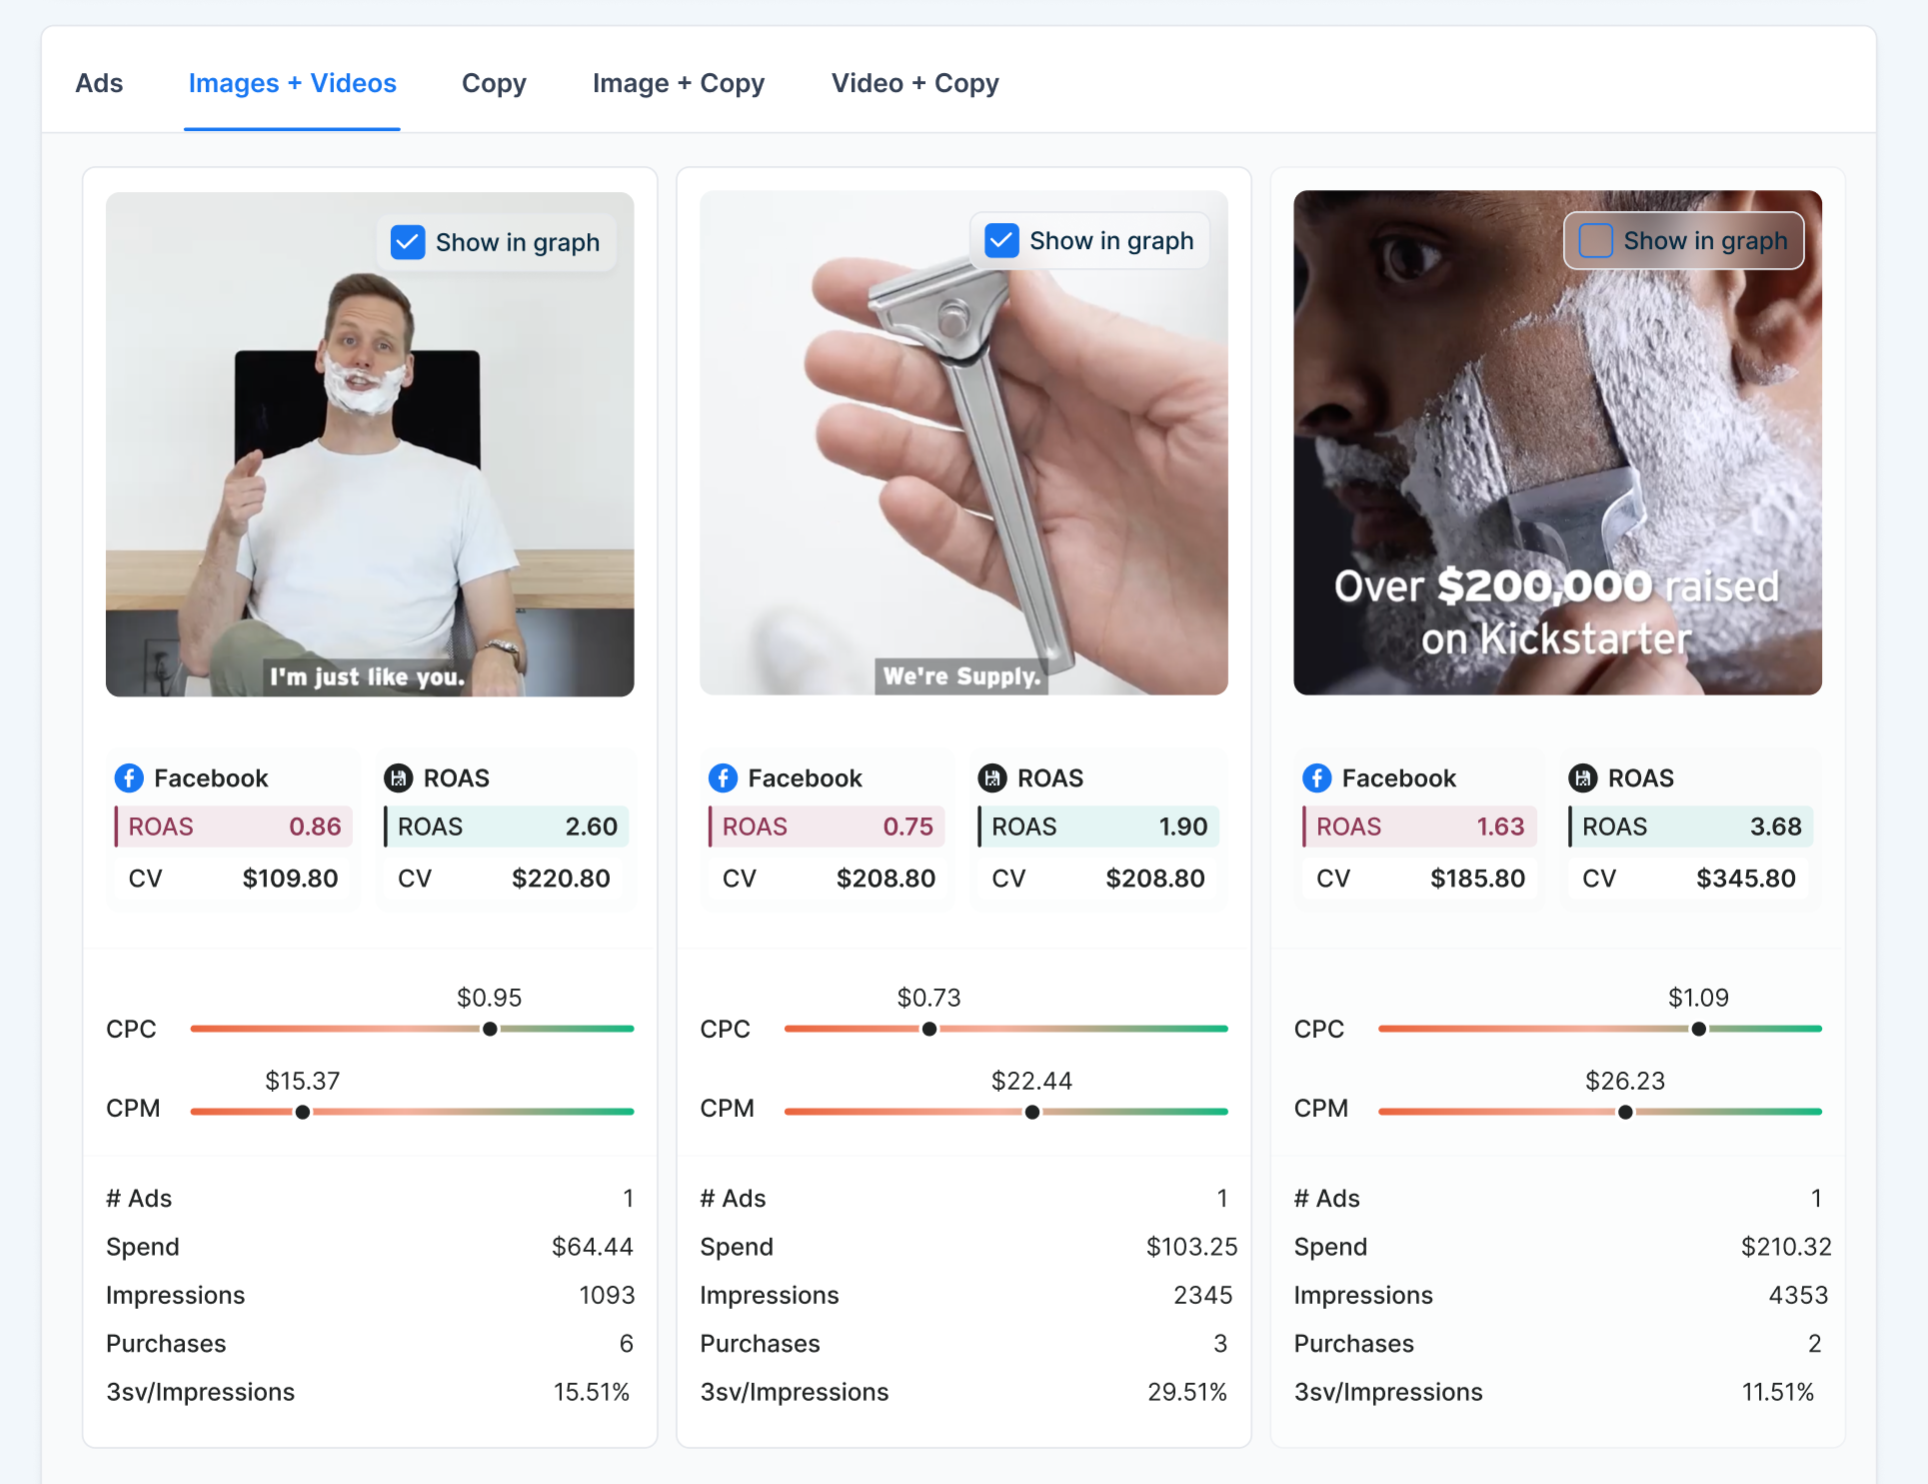
We use these 4 custom metrics that share the story of your creative performance from start to finish and are very easy to follow.
3-Second View / Impressions
What percentage of people who see your video on their feed or story will watch beyond 3 seconds? That’s what Thumb Stop Rate reveals.
Purchases at 25%
Purchases / 25% Video View
Purchases at 50%
Purchases / 50% Video View
Purchases at 100%
Purchases / 100% Video View
Purchases at XX% metrics show the percentage of people who watched at least XX% of your video and ended up buying from you. Essentially, it shows how effective your video is in convincing people to buy and what creatives to use at what stage of your funnel.
Example:
We created an “Us vs. Them” comparison creative for our client. We tested the creative on top of the funnel audience and the performance was weak.
Looking at the metrics above, we realized the video was boring for people who had never heard of the brand. No wonder! Why would they watch a comparison video between our client’s product and other products if they had never heard of the brand?
However, the Purchases at 100% metric showed us that 12% of people who watched the entire video bought the product. There were two ways we could scale this creative:
We decided to move forward with the second option and the creative immediately became and stayed the top performer in the middle of the funnel for months.
To avoid confusion between the media buyer and the rest of the team, I recommend using a clear naming convention that your team will be familiar with.
Here is what we use with our clients:
Platform Number - Product Name - Creative Concept - Order Number - Creative Ratio
Examples:
01 Kids Multivitamin - X Reasons Why 1 4X5
02 Daily Moisturizer - Life Hack 2 9X16
03 Whey Protein - Morning Routine 1 16X9
You need to have a set element you want to test and use the right metrics to assess the performance. Some of the most common tests we run are:
Let’s say you want to test a new offer. What metrics should you focus on?
Would the metrics be different if you wanted to test a new hook? Absolutely! You wouldn’t need to worry about any of the metrics you look at when testing a new offer.
Instead, you would look at the Thumb Stop Rate that we mentioned before.
What if you wanted to test different CTAs (Call to Actions)? You could watch the following metrics that will tell you if people click on the video and buy after seeing the CTA:
See how we follow different metrics when testing different elements?
When you are sitting on a Monday meeting and your boss asks you how a specific creative performed last week on Facebook and TikTok - how long will it take you to find the answer?
What if you could just look at a simple dashboard and know the answer in a few seconds? Even better, what if your boss could look at the dashboard and have all the answers?
Well, it’s definitely possible if you build your creative performance dashboard as we do for our clients.
You can pull the most critical data from any advertising platform and review it every morning to fully understand your creative performance. Or, as I usually do, open the dashboard every 30 minutes.
If you don’t want to let go of good old Google Sheets, you can still track the performance of your creatives, but it can take up to a few hours a month to keep the spreadsheet updated.
You can start by creating a new spreadsheet with the following columns:
To communicate the performance visually, you want to highlight the Creative Name using one of the 3 colors (red, yellow and green) based on the CPA or ROAS.
Have a set of rules for determining if the creative has a strong, average or weak performance to avoid reacting emotionally.
It could look something like this:
Analyze your weak and strong performing creatives and find similarities and differences. Then, summarize learnings from reporting to drive the next batch of creative.
Remember how I warned you that there is no single method that works for every business?
I’ve had conversations with media buyers who don’t test a new creative unless they have 3 different versions of it. They say it’s the only way to get a reliable data sample. And I’m not here to argue. If this approach works for them, that’s great! What you have to keep in mind is their brand and advertising spend.
We found that the most effective (time and money-wise) creative testing method is launching only one version of a creative and watching the performance. One hook. One call to action. It makes producing and testing new creatives easier without spreading yourself too thin.
The metrics we look at during the initial test are:
If the Thumb Stop Rate is below average, we know that our hook is weak and needs to be replaced. Only then do we create a new version of the creative with a different hook and repeat the testing process.
If the Thumb Stop Rate is average or above average, we don’t need to change the hook. We look at the other 3 metrics to assess performance of the creative.
If the performance is weak, we scrap the creative and save time and money we would have wasted testing multiple versions of the same low-performing creative.
If the performance is average or strong, we look at additional metrics to determine how we can improve the creative. At this point, we start creating new versions of the creative and testing new hooks, call to actions or shorter and longer versions to bring the creative to the green status where we start scaling.
Remember, test one element at a time and creatives you least expect to perform will sometimes be your winners for months.

.png)
© Triple Whale Inc.
266 N 5th Street, Columbus OH 43209


